Interactive index show how each U.S. state measures up in EV charging
By onMarket Trends | Technology
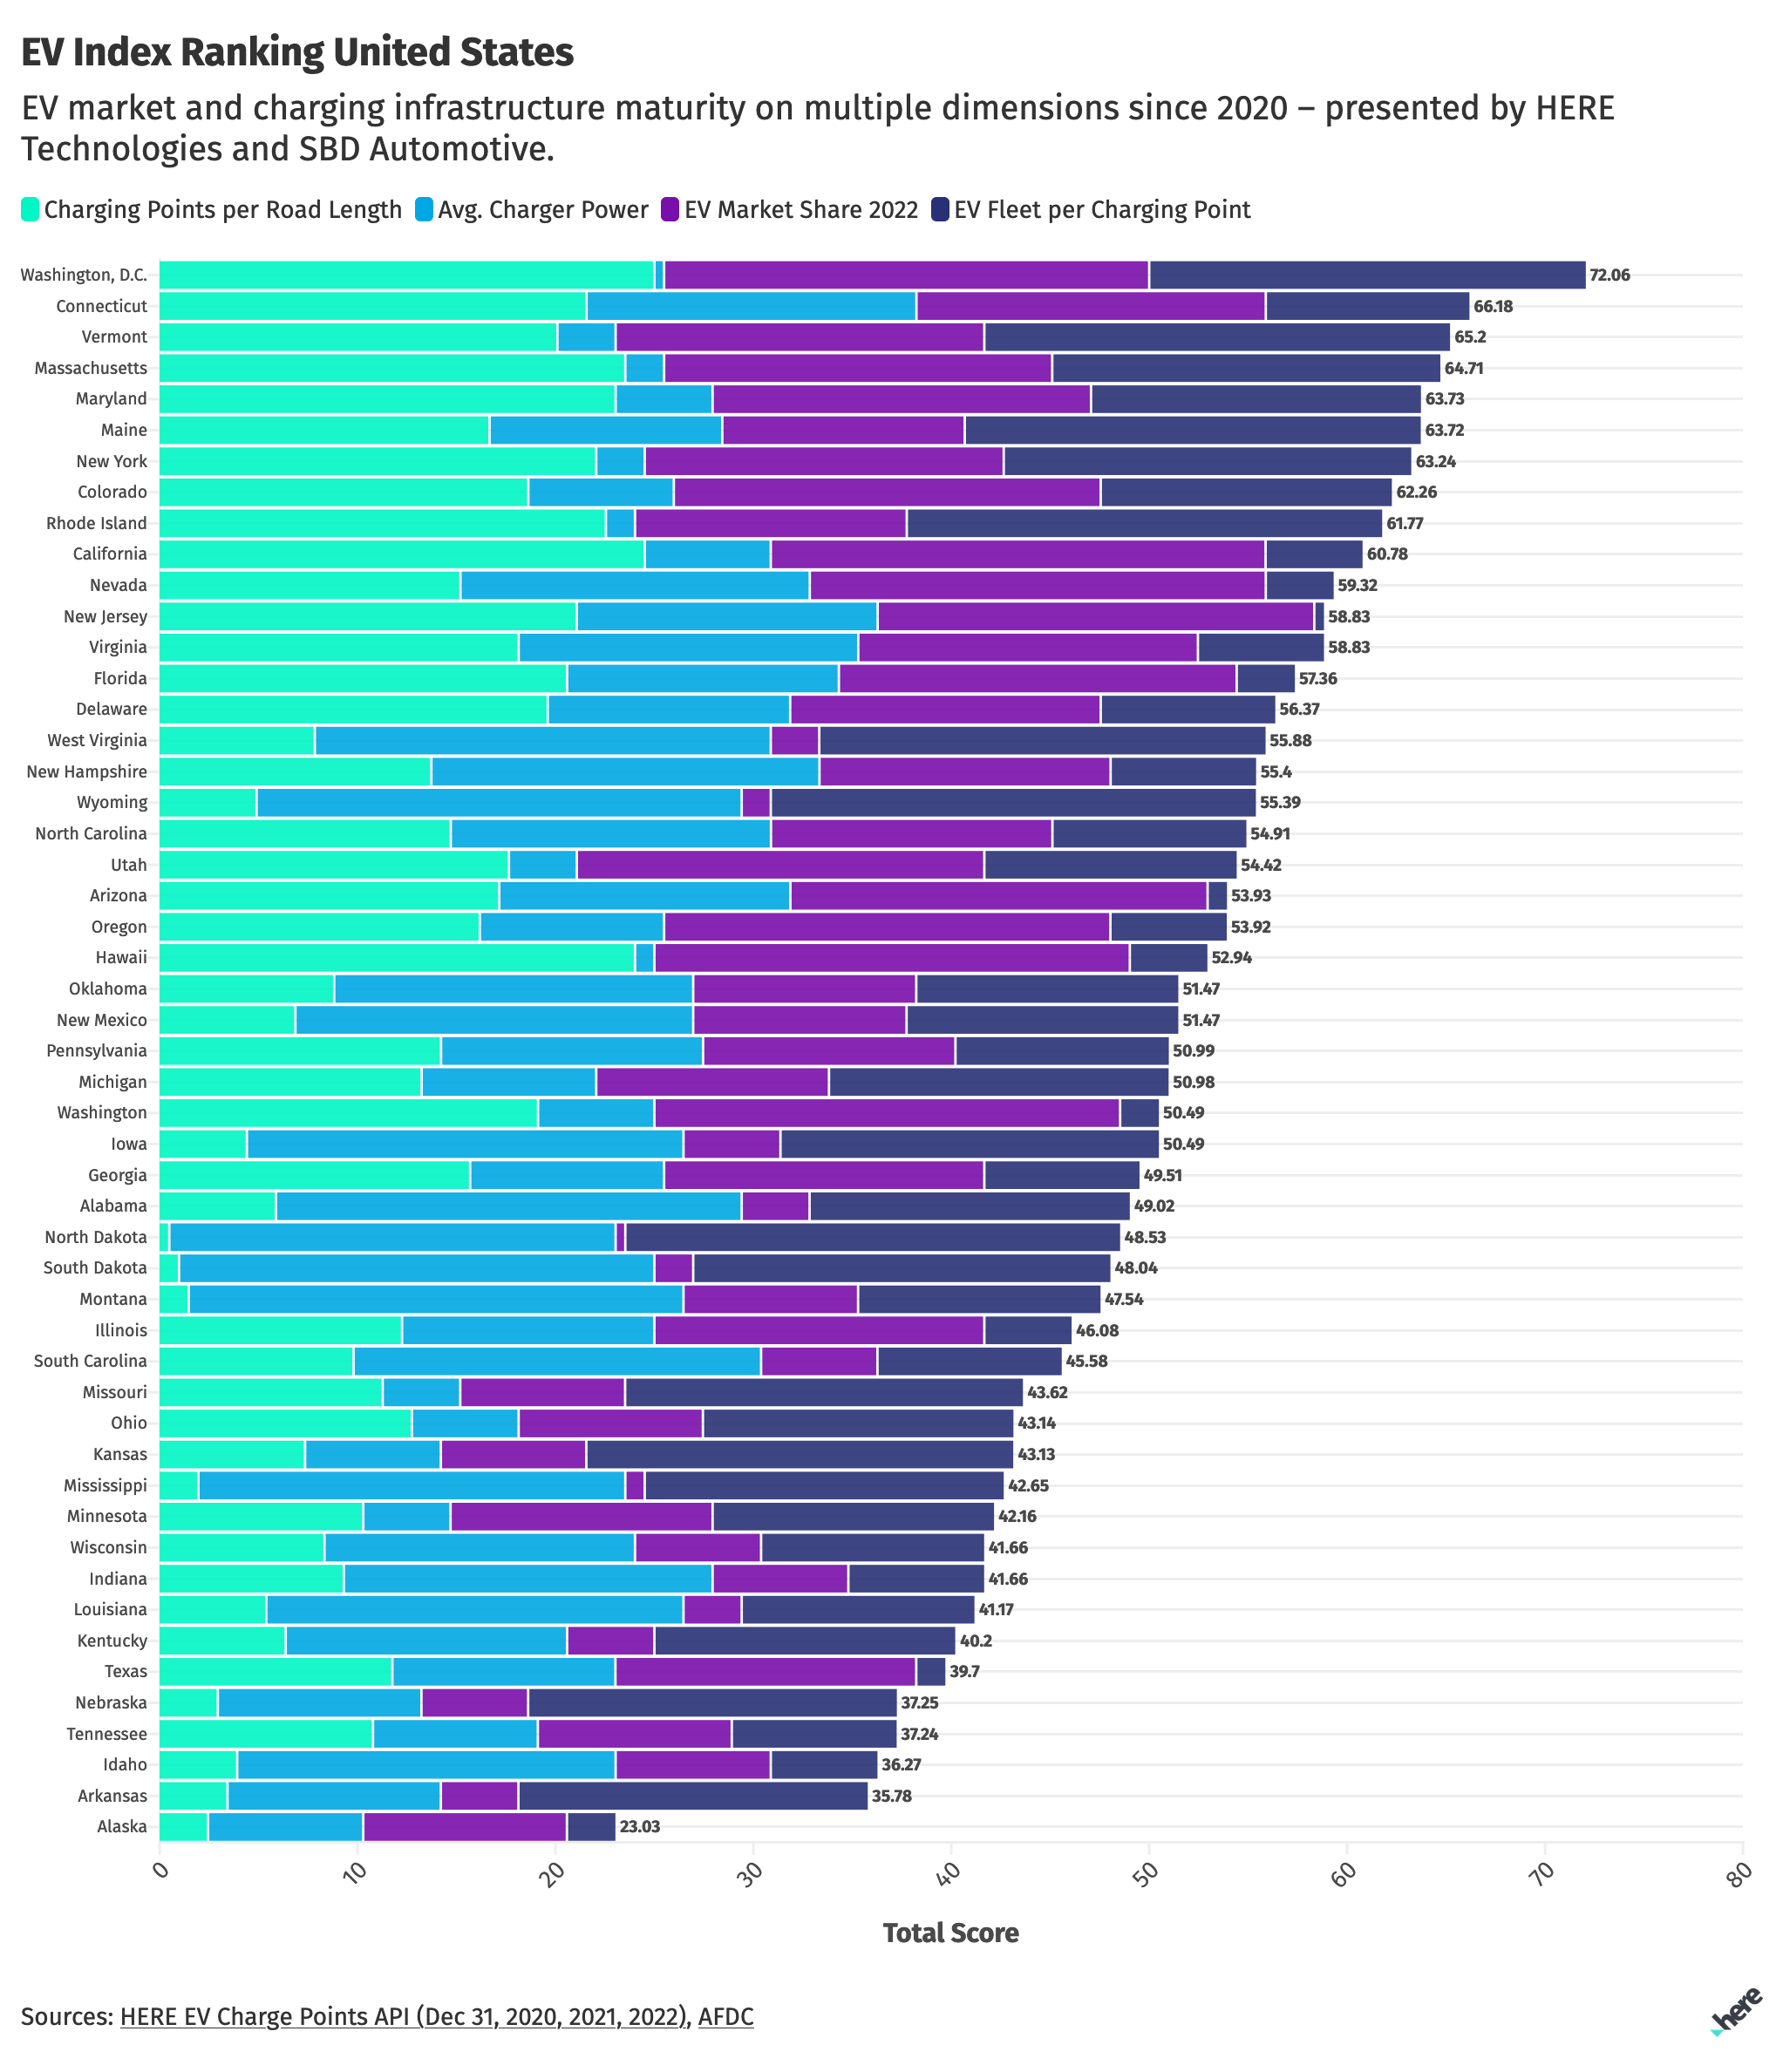
A newly published interactive index shows that Washington, D.C. is No. 1 in electric vehicle (EV) charging infrastructure availability while California rounds out the bottom 10 states with the worst vehicle-to-charger ratio.
Since 2020, HERE Technologies, a location data and technology company along with SBD Automotive, a global automotive research firm, have based their EV index on:
-
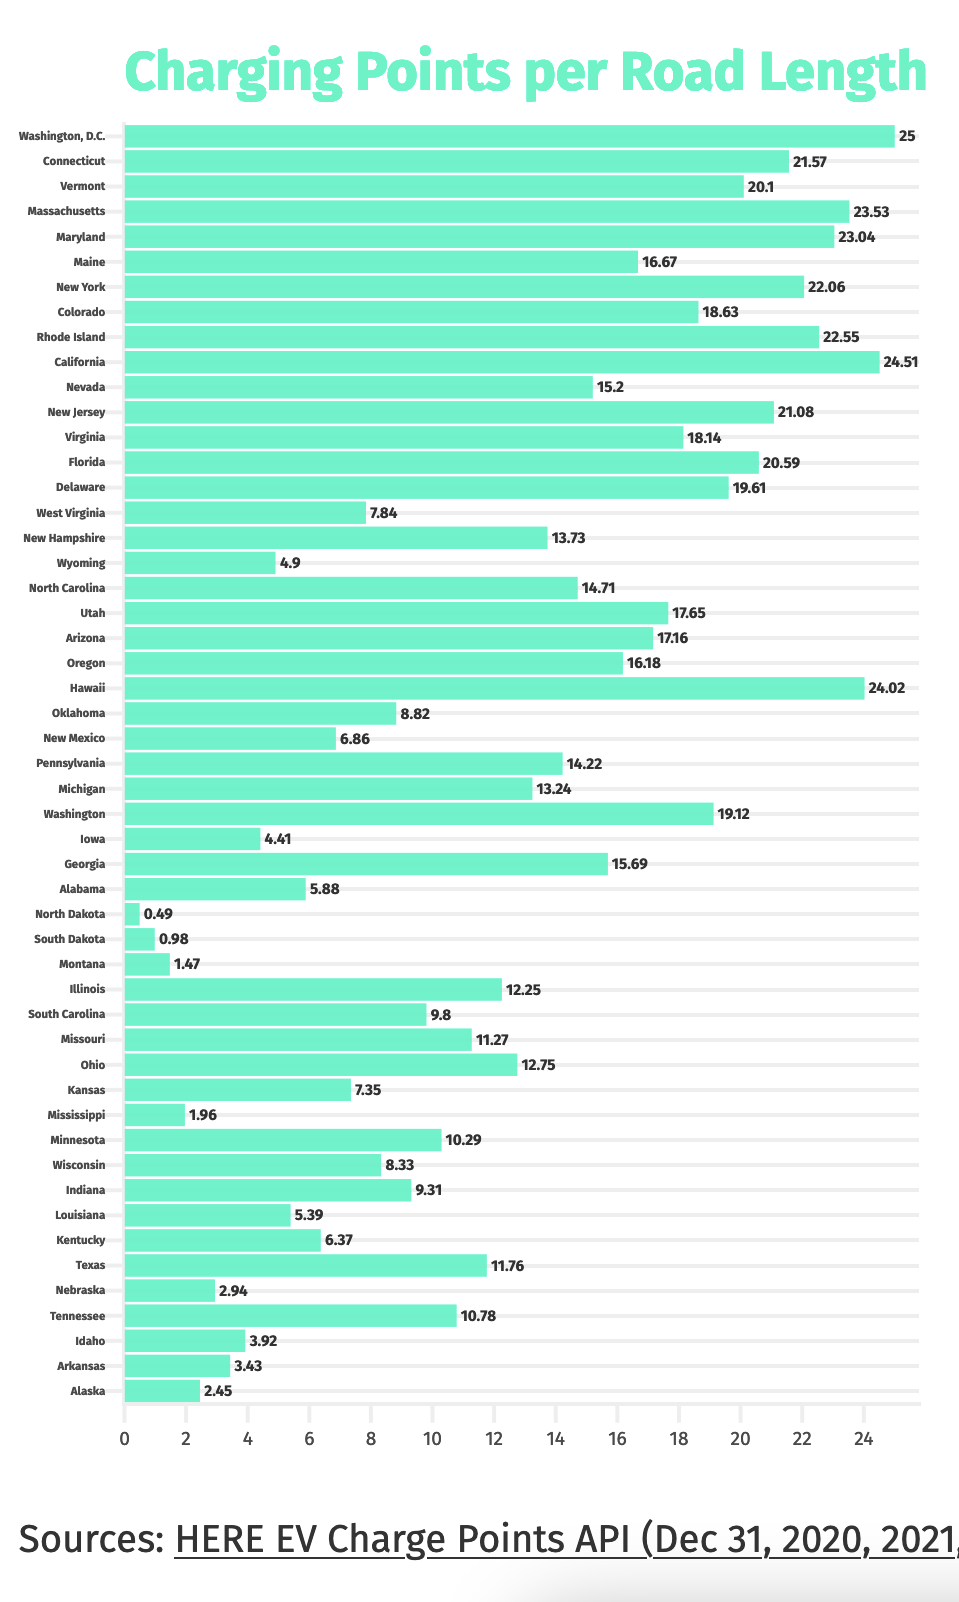
- How far EV drivers must go to find a charger to determine the number of public EV chargers per road length;
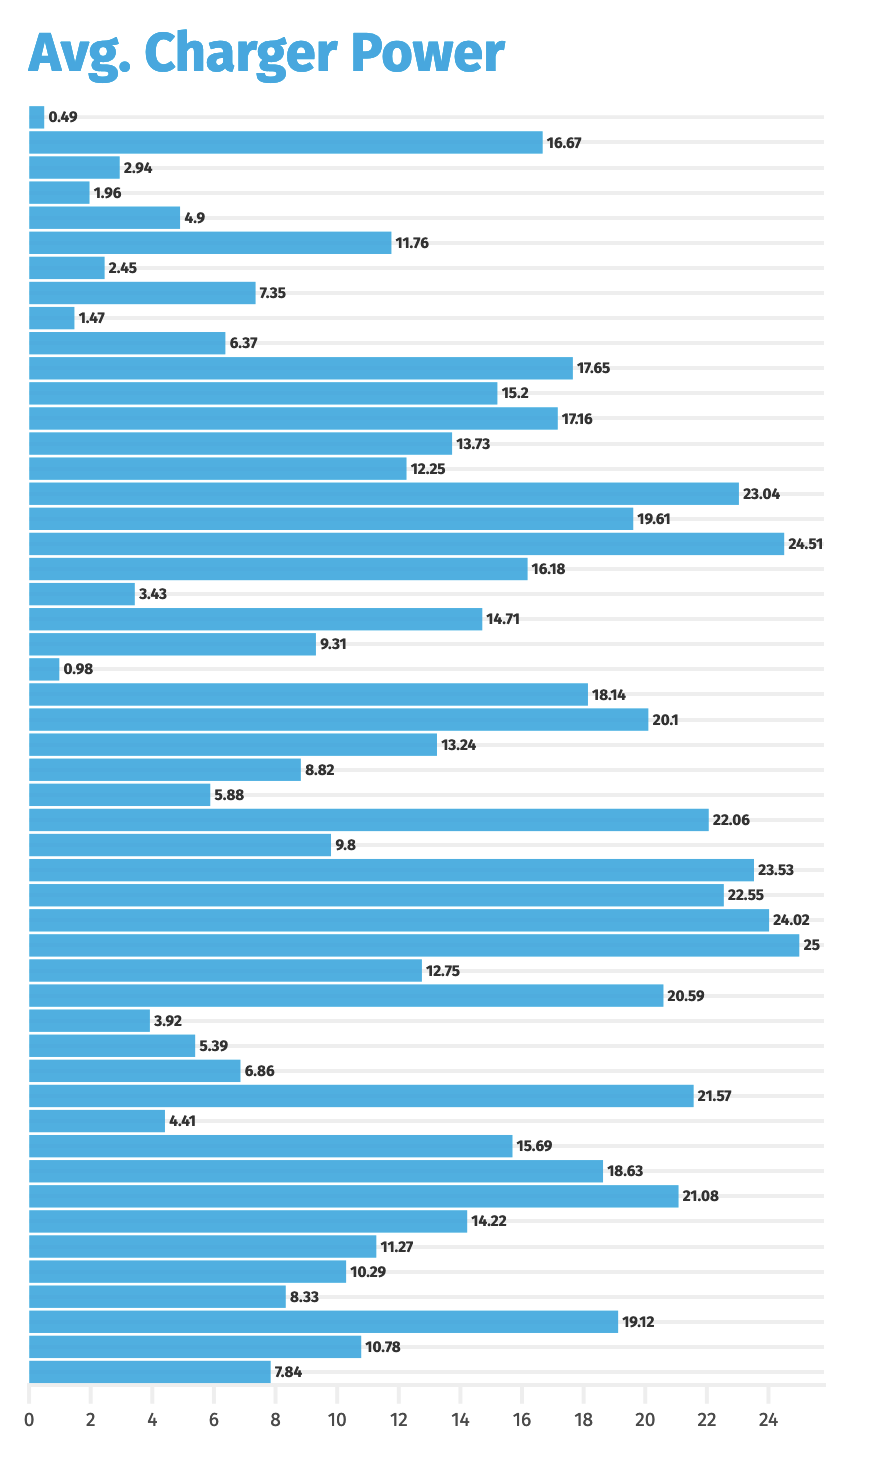
- How quickly EVs can be charged to determine the average power capacity of public EV chargers;
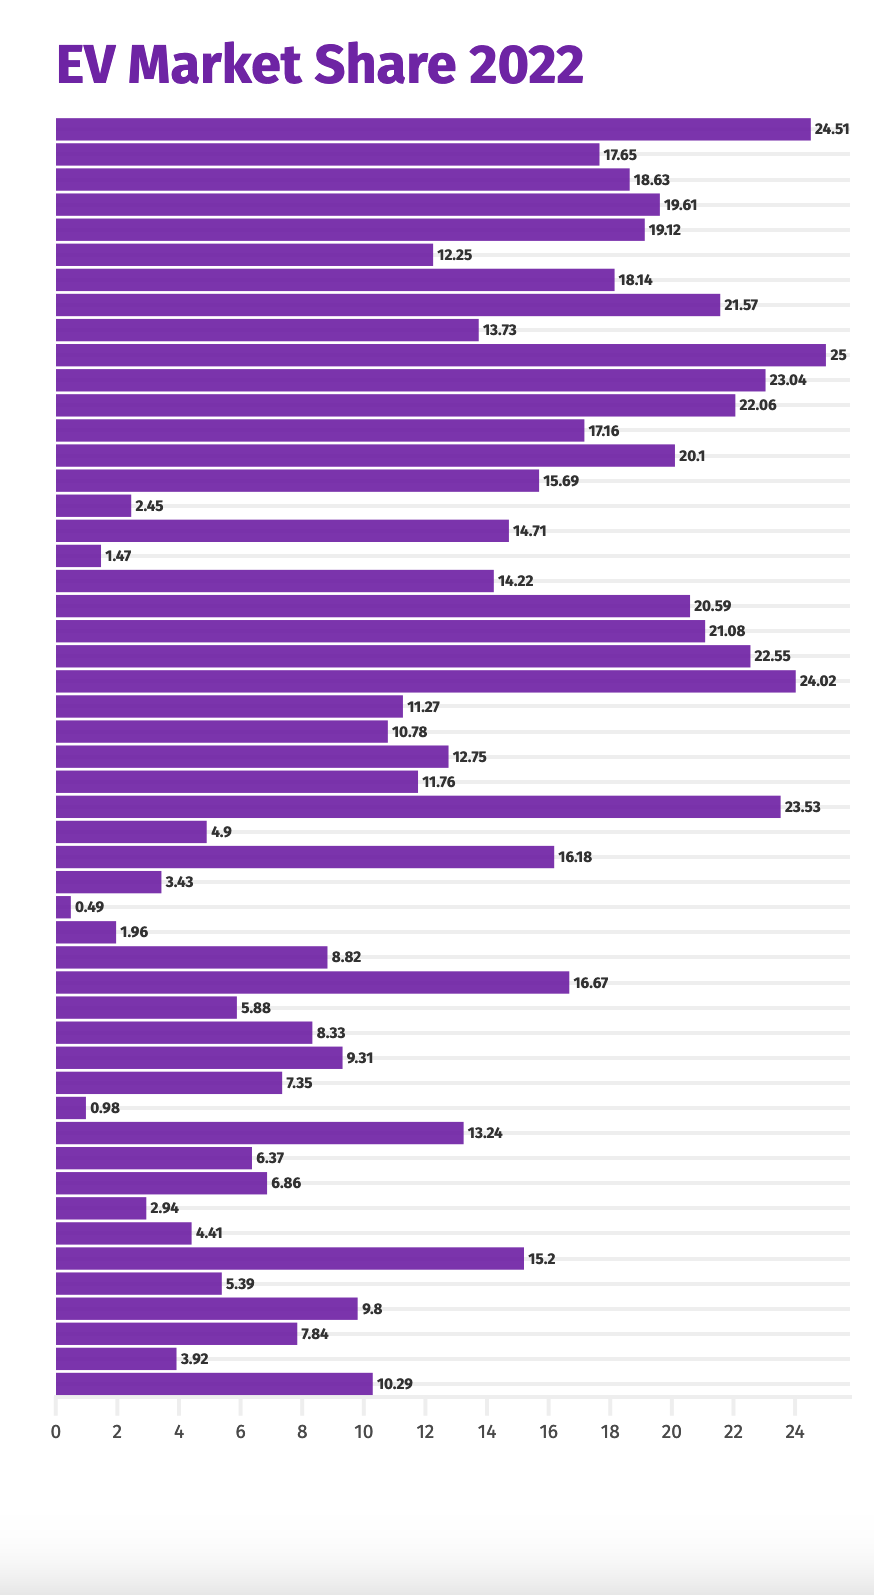
- The number of EVs on the road versus internal combustion engine (ICE) vehicles to determine EV fleet share; and
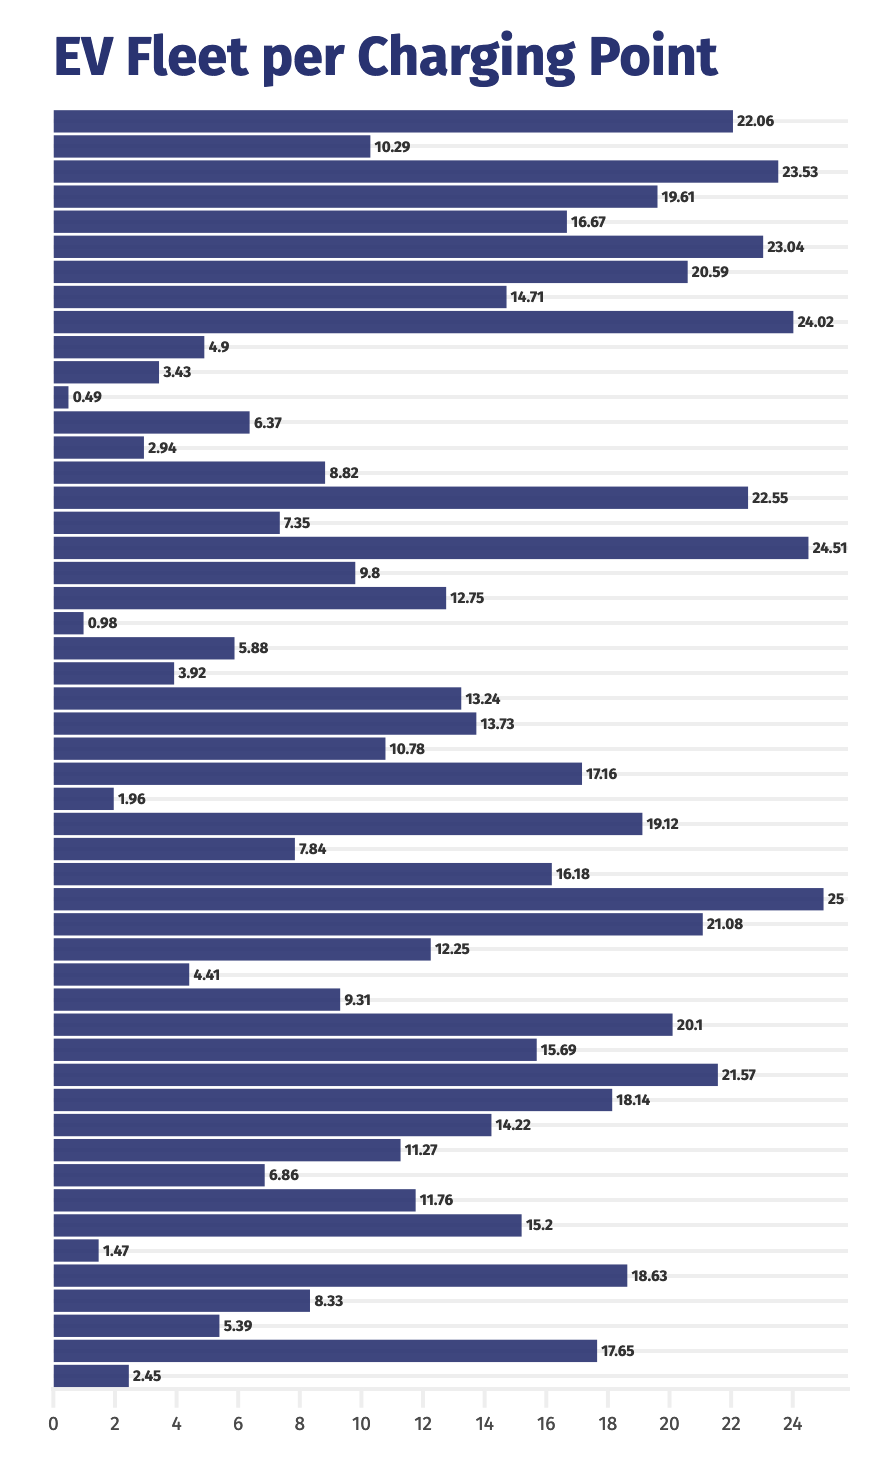
- The likelihood of finding an unoccupied charger to determine the ratio of registered EVs to public chargers.
The EU-27 plus Norway, Switzerland, and the UK were also evaluated. Each U.S. state and European country received a score of up to 25 for each metric.
However, the companies note that every state and country has its own unique circumstances around EV adoption and charging infrastructure so some metrics may make more sense by market. For example, in many U.S. states, it’s important to use the number of registered EVs per charger ratio while in more mature markets, a power-per-EV ratio can be more useful.
With that in mind, there were nearly 1 million EVs registered in California by 2022 because of the state’s large population and geographic size, making it one of the most developed EV charging networks in the U.S. There are more than 46,000 chargers in the state. However, California comes in at the bottom of the 10 worst states in terms of EVs per charger with a ratio of nearly 20 to 1.
Eight to 12 EVs per public charging point tends to be the ideal ratio for the average market to support seamless, convenient public charging, according to analysis from SBD Automotive.
“As the market matures, this ratio should increase as geographic coverage becomes less critical,” a joint news release from HERE and SBD states. “This also prevents over-supply enabling charge point operators to turn a profit, sustaining its industry.”
The best EV-ready states, followed by D.C. at the top, are Connecticut, Vermont, Massachusetts, Maryland, Maine, New York, Colorado, Rhode Island, and California.
The bottom states in overall readiness are Wisconsin, Indiana, Louisiana, Kentucky, Texas, Nebraska, Tennessee, Idaho, Arkansas, and Alaska.
Based on their index, HERE and SBD say each public charger should have the capacity for eight or nine EVs with each state having its own ideal ratio based on market maturity metrics. U.S. EV market share in 2022 was just over 7%.
As the market-leading state in the U.S., California’s ideal ratio would be close to 12 EVs per charger. On the other hand, North Dakota, with a large land area and very small EV fleet size, would need to aim for closer to two EVs per charger.
In Europe, Norway came in first as the most EV-ready country followed by the Netherlands, Luxembourg, Germany, Switzerland, Denmark, Czech Republic, Bulgaria, Sweden, and Belgium, according to the index.
Countries coming in last in EV readiness are Italy, the UK, Hungary, Romania, Ireland, Poland, Lithuania, Greece, Malta, and Cyprus.
A key feature of the European Commission’s infrastructure targets (AFIR) focuses on travel between EU countries, meaning that important travel and commerce corridors through countries with a low EV market penetration, like Bulgaria, will have a high density of chargers relative to registered EVs.
“While the maturity of charging infrastructure in each state and country generally follows population density and wealth, the index clearly demonstrates that external factors such as government incentives help equip lower-density areas with much-needed charging capacity,” said Robert Fisher, SBD Automotive EV principal. “Charge point operators and regulators must continue to monitor the ratio of EVs to charging stations and power availability to the size of the EV fleet in communities and along corridors to ensure a seamless ownership experience as EVs go mainstream, while at the same time protecting infrastructure operating revenue.”
All EV charging location data was pulled from the HERE EV Charge Points API for December 1st of 2020, 2021 and 2022. Only battery electric vehicles (BEVs) are included in the index.
“Electric vehicles are top of mind for consumers, governments and the auto industry all over the world. Stemming from the development of our EV Charge Point Predictions product, HERE and SBD have uncovered a growing discrepancy in the ratio of EV charge points to EV vehicles on the road,” said Chris Handley, vice president of dynamic spatial content at HERE Technologies. “Our analysis shows how much work needs to be done in order to usher in a fully electric mobility future.”
Images
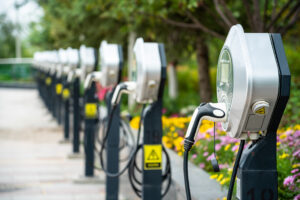
Featured image: Stock photo of EV chargers. (Credit: Young777/iStock)
All charts/graphics provided for use by HERE Technologies and SBD Automotive.