MY 2021-2023: Cars and minivans have highest claim frequency, severity
By onMarket Trends
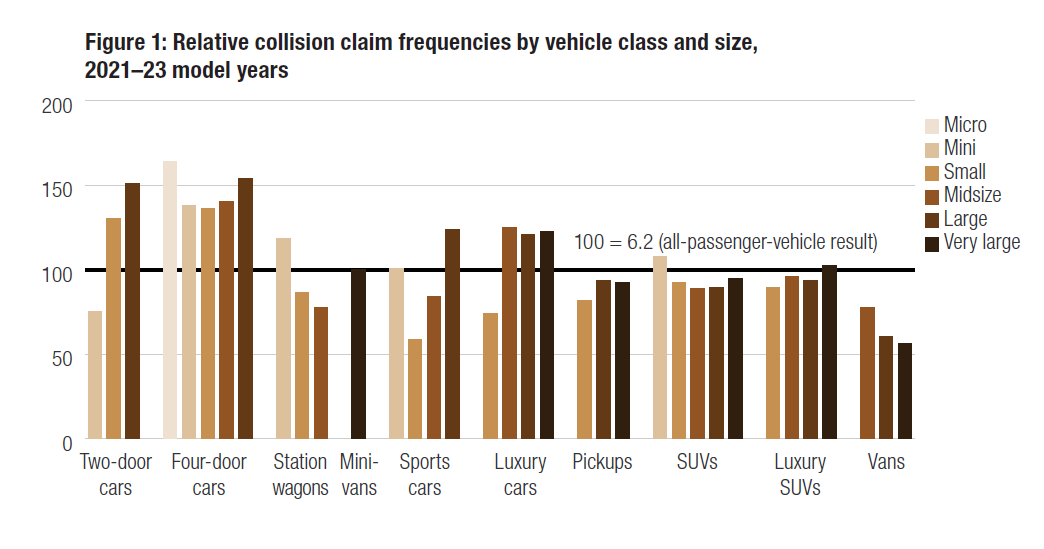
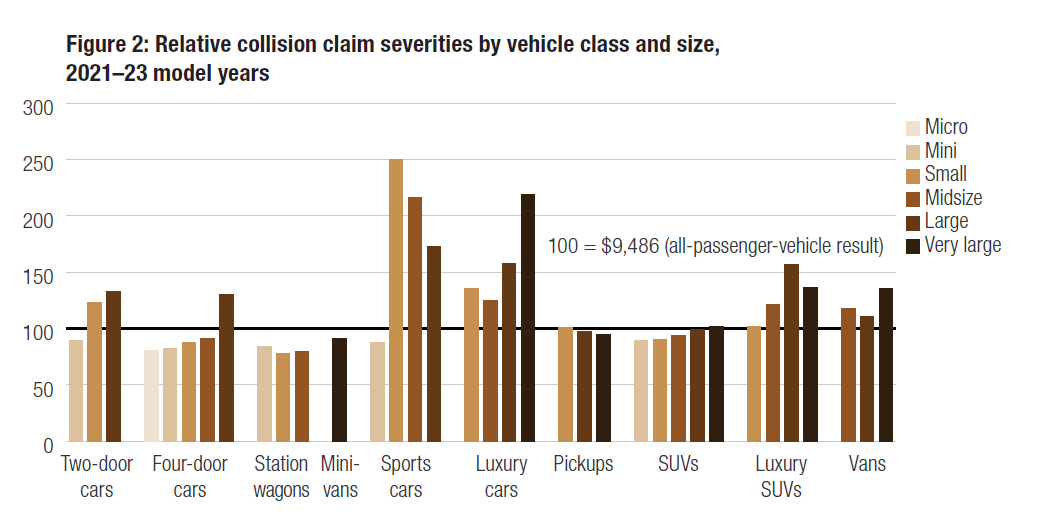
New data from the Insurance Institute for Highway Safety (IIHS)’s Highway Loss Data Institute (HLDI) indicates that collision claim frequency for 2021–2023 model year passenger vehicles was 6.2 claims per 100 insured vehicle years with the average loss payment per claim (claim severity) being $9,486.
Two main factors determine collision losses. One is how often claims are filed (claim frequency). The other is the size of the claim payments (claim severity), which depends on the extent of the damage. These two factors indicate overall insurance losses or average loss payment per insured vehicle year. Overall losses represent the average cost of insuring a vehicle for one year, excluding administrative costs.
A score of 100 in collision for a particular model year means the car’s average collision repair claim equaled the average dollar amount observed by the combined model year vehicles covered in the report. A model with collision claims 10% higher than average would be rated 110, while one with bills 10% lower than average would receive a 90. This allows a carrier to understand the potential risk of insuring a particular vehicle and price the premium accordingly.
The studies focus on claim frequencies, severities, and overall losses, not repair costs. HLDI’s “Collision Losses: First Look” report for model years 2021–2023 was released in December. An updated, final version will be published in spring 2024.
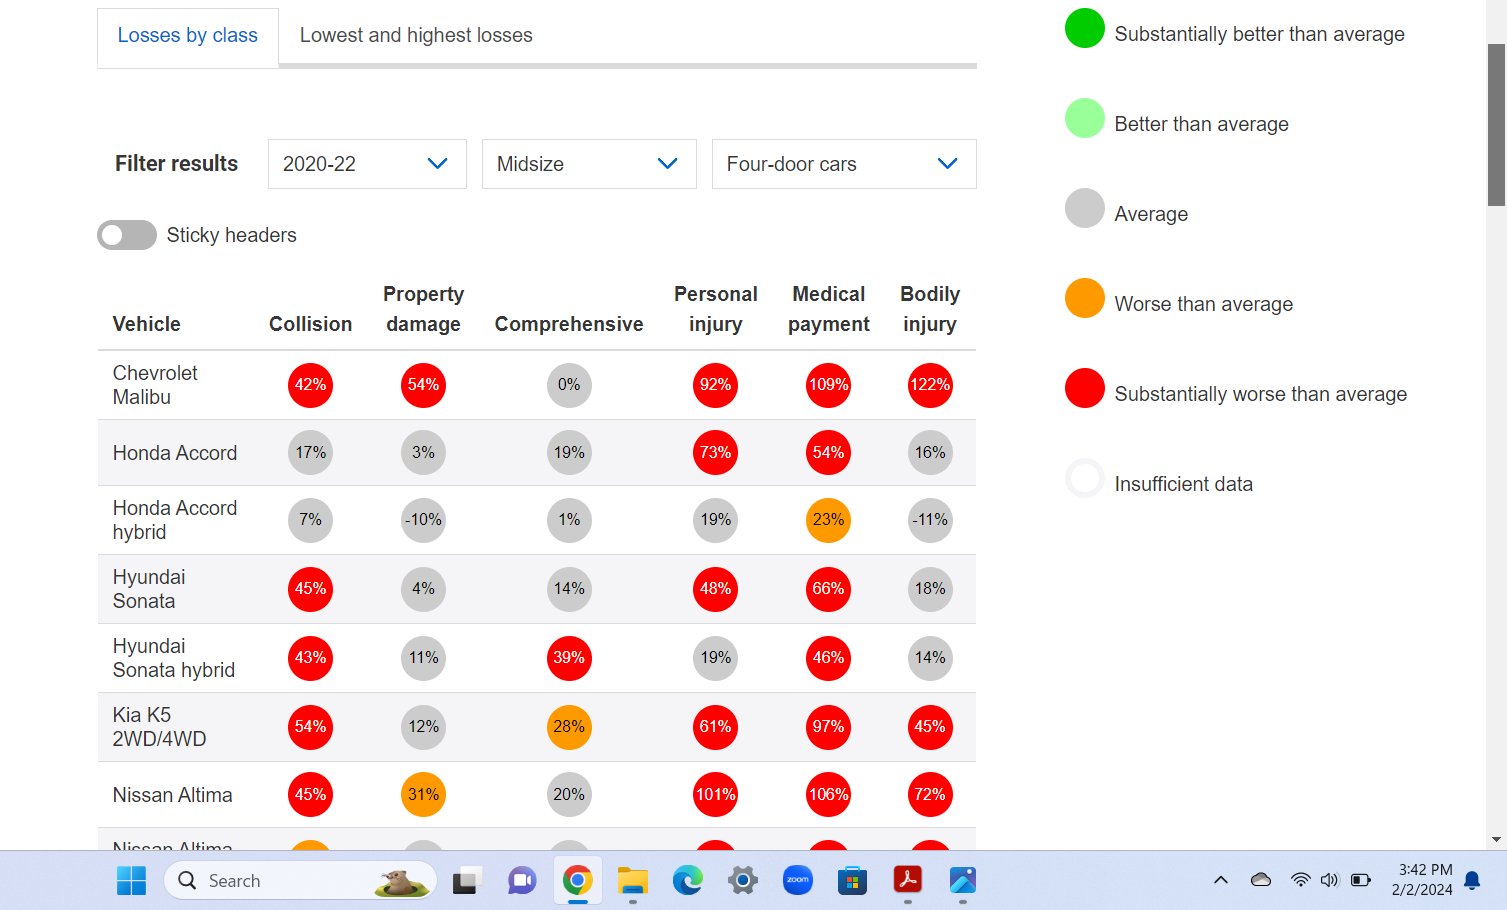
The percentage and color coding help consumers see which models have insurance losses that are better or worse than average. Since they are displayed by size and class, they also show how individual vehicles compare with similar models.
For example, out of 2020-2022 midsize four-door cars, the Subaru Legacy with EyeSight faired better than average in collision, personal injury, and bodily injury. It was also substantially better than average in property damage. None of the 15 other cars in the category, from Chevrolet, Honda, Hyundai, Kia, Nissan, Toyota, and Volkswagen, received either rating.
The Chevrolet Malibu results were the worst, nearly across the board, with “substantially worse than average” scores in collision, property damage, personal injury, medical payment, and bodily injury claims.
Most vehicles in the small four-door category were average in all claim types except for the Chevrolet Bolt, Kia Forte, Nissan Sentra, and Nissan Versa.
The Bolt had all “better than average” or “substantially better than average scores.”
The Forte, Sentra, and Versa were the opposite. Each received “worse than average” and “substantially worse than average.” The Sentra was the worst of the three in collision claims.
Vehicles with the highest collision losses are mostly sports- and luxury-class vehicles such as the McLaren 720S convertible, several BMW models, Ferrari, Rolls Royce, Aston Martin, and the Dodge Charger SRT Hellcat.
Those with the lowest collision losses include mostly large and very large vans and pickups. No. 1 is the Toyota Tundra double cab LWB. Last on the list is the 4WD Ford T-350 Transit cargo van.
The average loss payment per insured vehicle year (overall loss) was $591. Collision overall losses tended to increase with vehicle size.
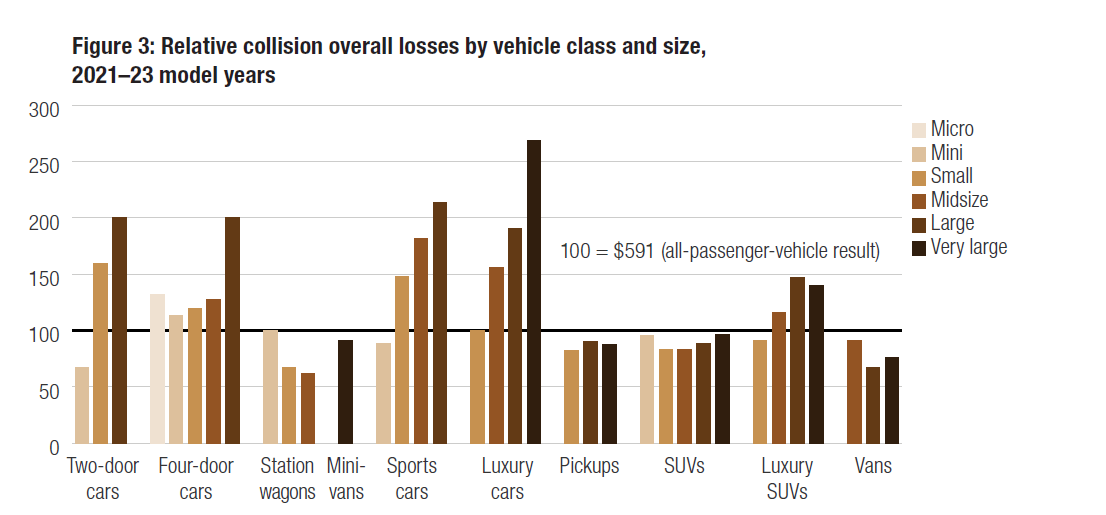
Passenger cars, including minivans, had the highest claim frequency at 7.7 and claim severity at $9,632, making cars the highest overall losses at $745.
For the model years studied, collision claims numbered more than 660,000 for passenger cars and nearly 1.4 million for pickups, SUVs, and vans.
The research also covered average damage amounts by point of impact compared to whether or not the vehicles were equipped with a standard advanced driver assistance system (ADAS) bundle.
The highest percentage of claims occurred for front-center impacts, HLDI found. When the bundle was unavailable, front impacts made up 26.3% of claims compared with 20.7% when the bundle was standard.
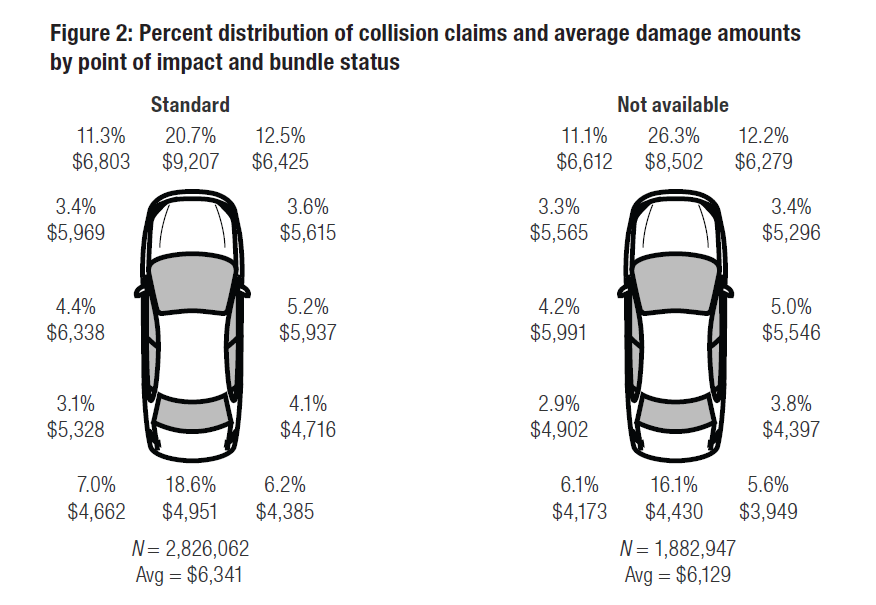
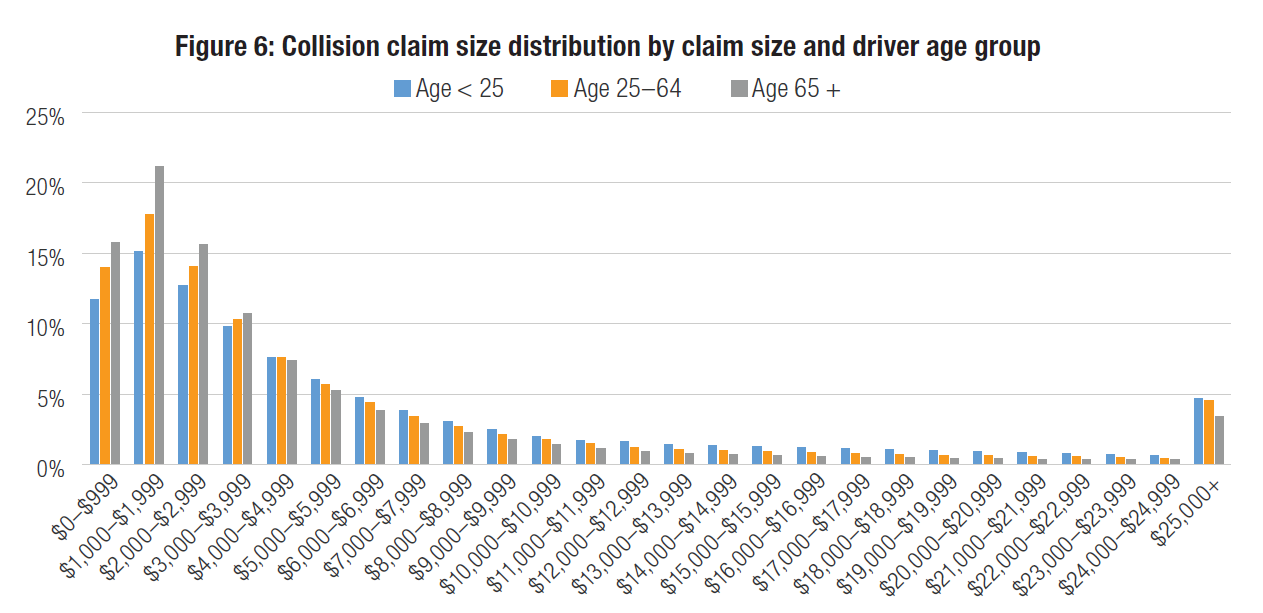
The new research, along with two other recent IIHS studies, conclude that ADAS-related collision reductions were largest for drivers under 65. Frontal claims represent a higher percentage of collision claims for young drivers than other age groups, regardless of feature availability, according to HLDI.
Electric vehicle total losses
In HLDI’s evaluation of electric vehicle (EV) losses compared to their internal combustion engine (ICE) vehicle counterparts, the average total loss rate was 18.3% versus 23.9%.
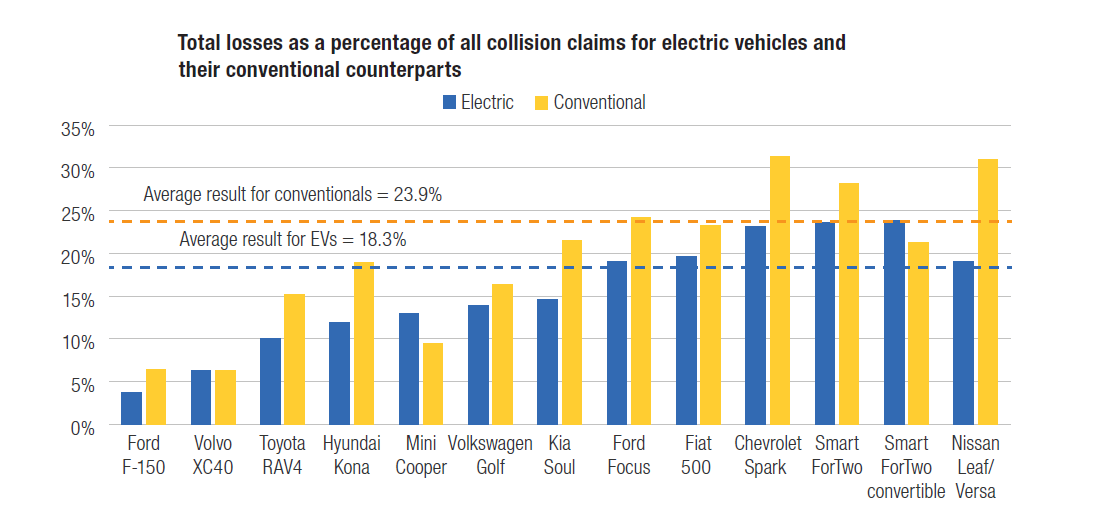
For EVs, the average collision loss payment was $5,474, the average payment for total losses was $14,444, and the average salvage recovery amount was $5,289, according to the report. Each amount was higher than the corresponding values for ICE vehicles.
The average total loss rate was lower for EVs with direct ICE counterparts at 16.7%.
In contrast, the average EV collision loss payment was $5,837, the average payment for total losses was $16,168, and the average salvage recovery amount was $5,587. Each is higher than the corresponding amount for ICE counterparts.
Specific to Tesla’s total losses, rates generally increased as vehicles aged while the average payments for total losses and salvage recovery amounts fell.
HLDI compared 2017-2021 Model S, Model X, Model 3, and Model Y Teslas with ICE vehicles of the same size and class with similar base prices during calendar year 2021.
Total loss rates were generally lower for the Tesla sedans — Model S and Model 3 — than for comparable ICE vehicles.
The average payments for total losses and salvage recovery were generally higher than those of comparable ICE vehicles. HLDI said that could be because Teslas depreciate more slowly.
In 2021, 50.9% of dollars paid under collision coverage for the Model S were for total losses, and generally, the percentages were higher for older vehicles than newer ones.
All measures of total losses in 2021 were higher than in the 2019 and 2020 calendar years.
Total loss percentages for Model 3 vehicles were lowest for the newest vehicles and highest for the oldest, but the difference was small at 2.1 percentage points, HLDI said.
Personal, property, and multiple-vehicle claims
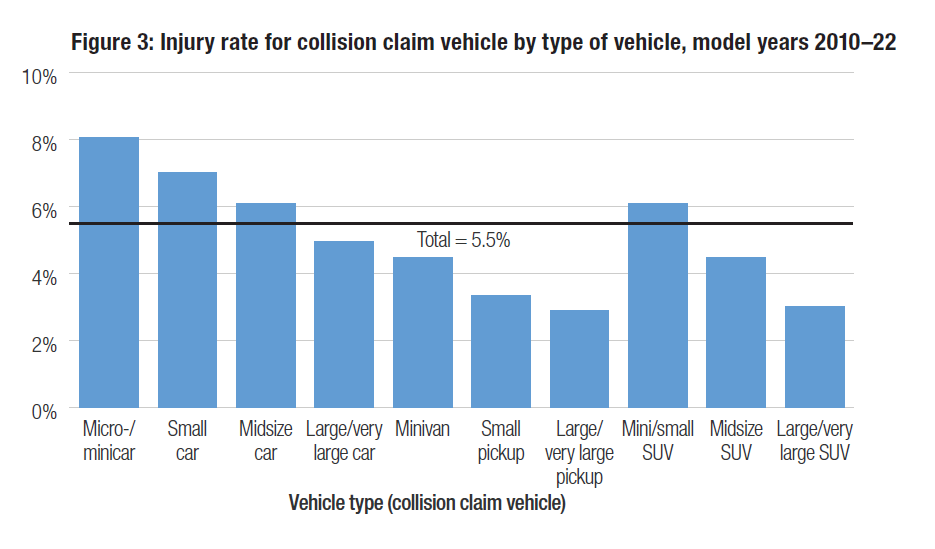
Personal injury rates were highest in micro- or minicars at 8%, followed by small cars at 7%. Large or very large pickups had the lowest injury rates at 3%.
The average injury rate across all vehicle types was 5.5%. A similar pattern was seen in property damage liability claims.
Micro- and minicars had the highest injury rates at about 15% and large or very large pickups had the lowest at 8%. The average injury rate across all vehicle types was 13%.
Being struck in the rear produced the highest injury rates in the vehicle that was struck with rates 14% higher than in front impacts. Right- and left-side impacts had lower rates than front impacts.
In multiple-vehicle crashes, HLDI found large differences in the injury rates of both the struck and striking vehicles depending on the vehicle type, point of impact, damage amounts, model year, rated driver gender, and the state in which they were located.
The most common pairing at nearly half the time was rear impact to the vehicle ahead.
“New vehicles sold in the United States are increasingly larger and heavier vehicles, including SUVs and pickups, leaving occupants of the passenger cars that remain on the road vulnerable to injury,” HLDI wrote. “In addition, the number of electric vehicles on the road is increasing. By 2030, an estimated 7% of the fleet will be electric vehicles, which weigh more than their conventional counterparts, leaving occupants of lighter cars at a high risk for injuries.
“As expected, the more severe the crash in terms of damage amount, the higher the injury rate for both the striking and the struck vehicle. Model year also plays an important role in the injury rate for both, while vehicle age shows less statistical significance.”
Bodily injury claims
HLDI’s newest research covered the frequency of bodily injury (BI) liability claims for 2020–2022 passenger vehicles as well.
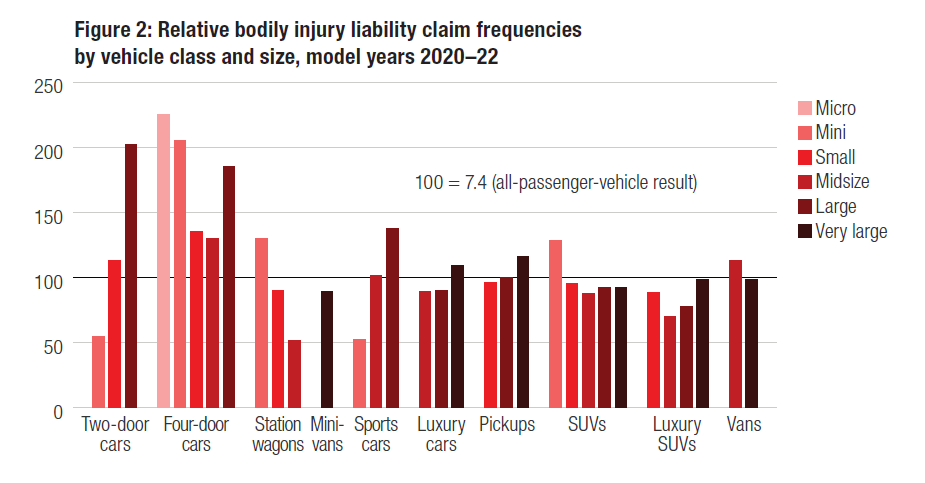
Frequency was 7.4 per 1,000 insured vehicle years and the average loss payment per claim (claim severity) was $20,300. The average loss payment per insured vehicle year (overall losses) was $150.
Overall losses were highest for large two-door cars followed by very large luxury cars.
BI claim frequencies were highest (16.7 claims per 1,000 insured vehicle years) for four-door microcars followed by four-door minicars (15.2 claims) and large two-door cars (15.0 claims).
Claim frequencies were lowest for midsize station wagons (3.8 claims).
In most size/class groups, claim severities tended to increase with vehicle size. BI claim severities were highest for very large luxury cars at $39,100 per claim and lowest for midsize vans at $16,270.
Images
Featured image: Stock photo of collision-damaged vehicles. (Credit: Chalermphol Liawsutee/iStock)
All graphs courtesy of IIHS HLDI