
CCC finds total cost of repair falling back in line with inflationary trends
By onMarket Trends
Cycle times and parts showed improvement during Q1 while labor costs and total repair costs continued upward, according to CCC Intelligent Solutions.
The trends analysis is part of CCC’s Crash Course Q2 2024 report, released late last week.
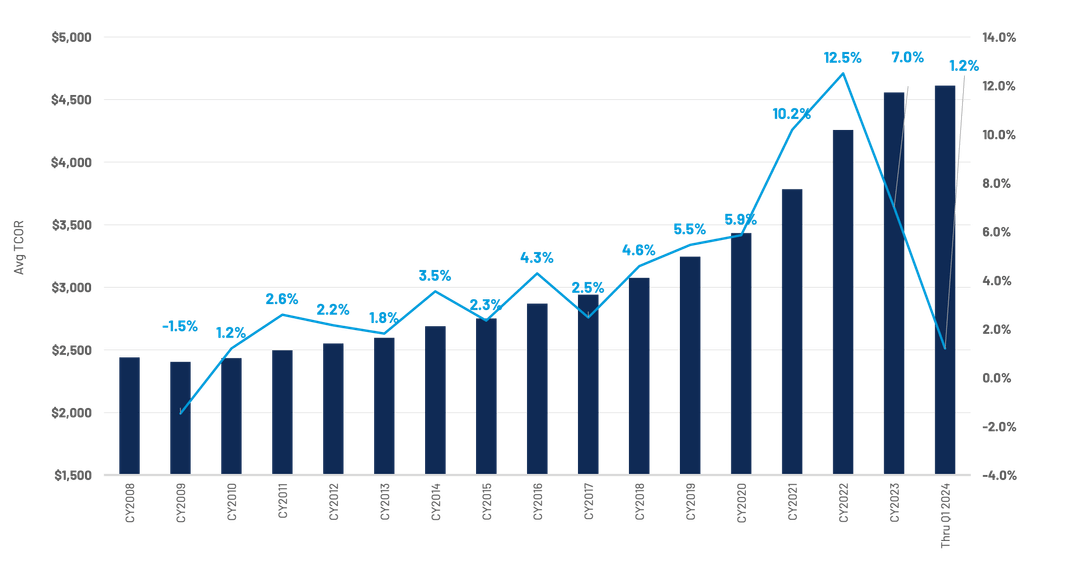
“The average TCOR for Q1 2024 currently stands at $4,611 — a 3.3% increase relative to Q1 2023 ($4,464),” the report states. “This increase may indicate that TCORs are beginning to fall back in line with inflationary trends.”
 According to the report, parts costs have stabilized following years of 7.3% and 5.4% increases, on average. The average price per part increased 0.1% in 2023.
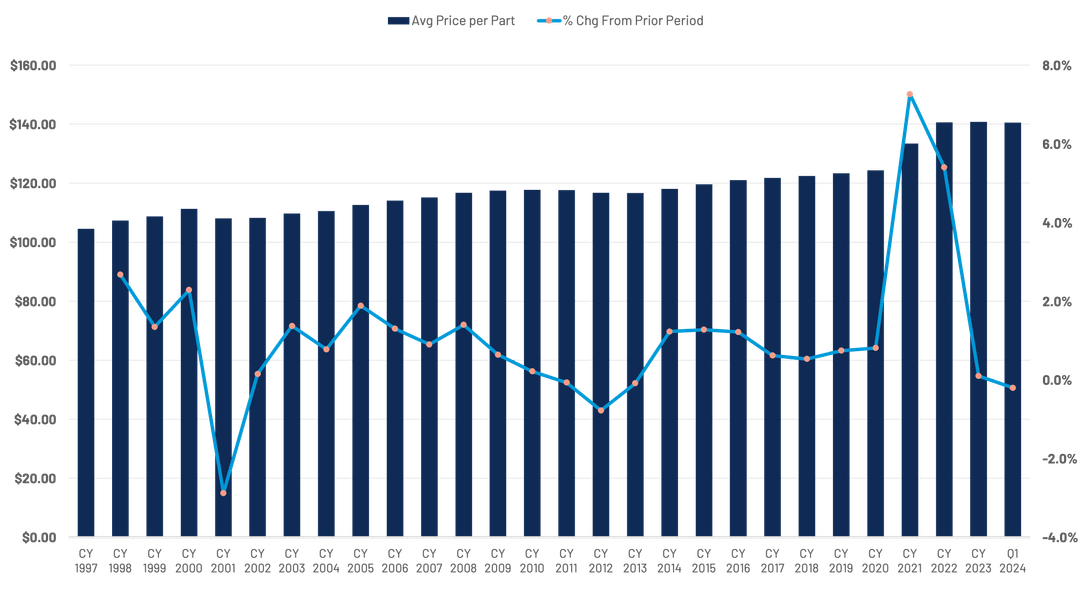
Parts per appraisal have slowed as well, only increasing from 13.6 to 13.8 after consecutive years of large increases.
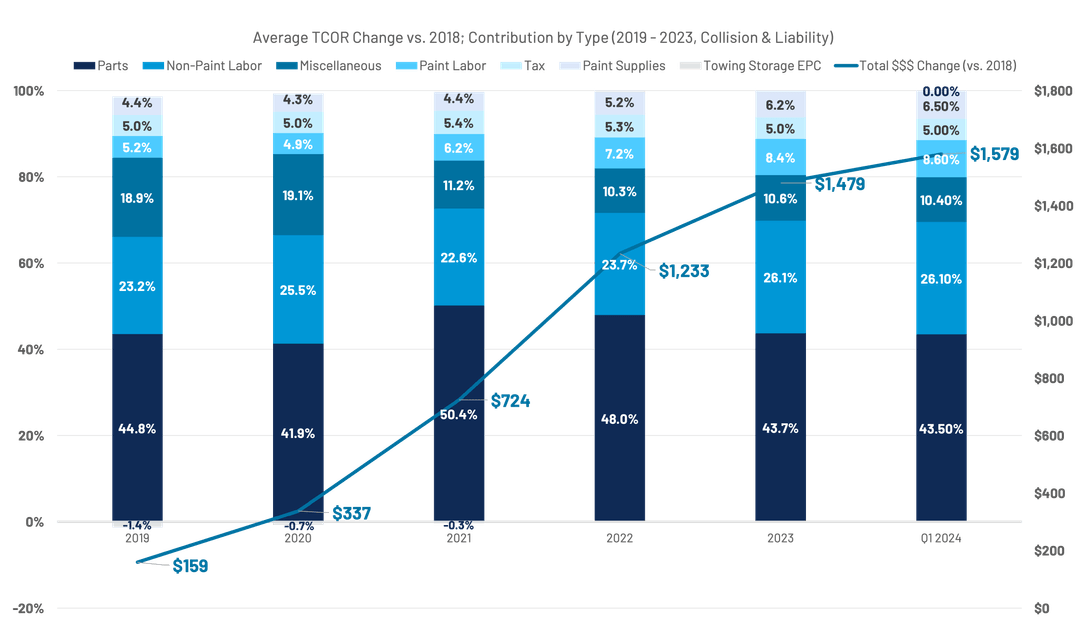
Total repair costs jumped double-digits in 2021 and 2022, and when indexed against 2018, parts contributed almost 50% of the increased repair costs, according to the report.
In 2023, the same contribution analysis revealed that parts accounted for a smaller share (44%) of the increase, while non-paint labor accounts for the largest contribution increase.
Non-paint labor accounted for the largest contribution to increased repair costs, up 7.4% for the year in 2023, and came on the heels of a 7% increase in 2022, according to the report.
Year-over-year, labor rates are up 3.2% when comparing first quarters, and up 5.2% overall, so far, in 2024.
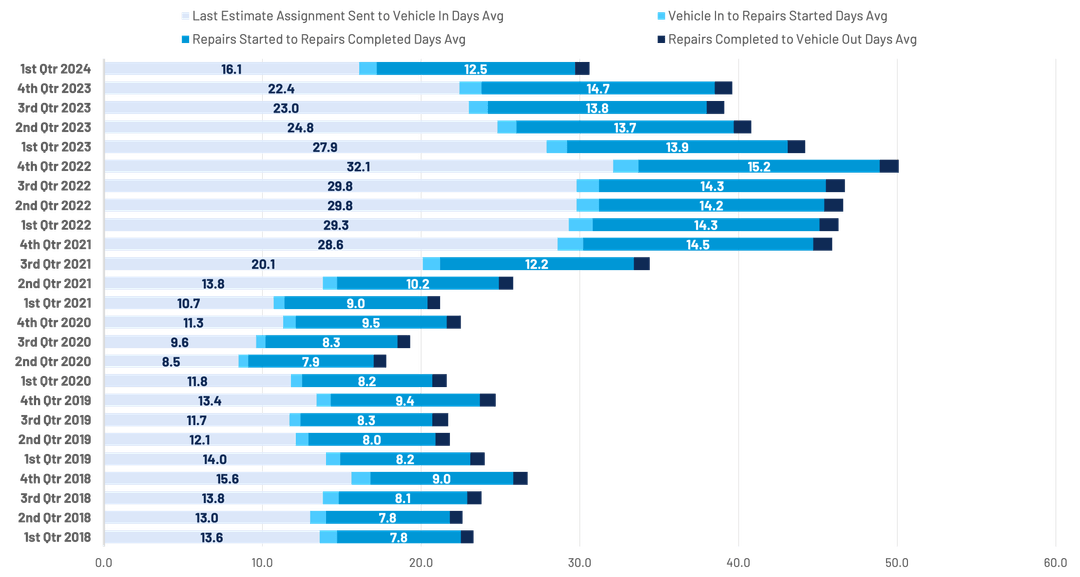
“Cycle times continue to improve, though both productivity and cycle times still lag pre-pandemic levels. Based on the current data, Q1 2024 saw a large decrease in cycle times, as vehicles were able to get into shops for repairs over six days less than in Q4.”
Electric vehicles
For EVs three years old or newer, the average Q1 2024 TCOR was $6,682, which was 19.5% higher than non-EVs within the same age group, according to the report.
“Labor accounts for the largest contribution to the difference between EV and non-EV repair costs for vehicles three years old or newer. Labor accounted for 43.5% of total repair costs in EVs three years or newer and 34.8% for non-EVs in the first quarter. Parts are almost the exact opposite — 38.9% for EVs and 44.6% for non-EVs.”
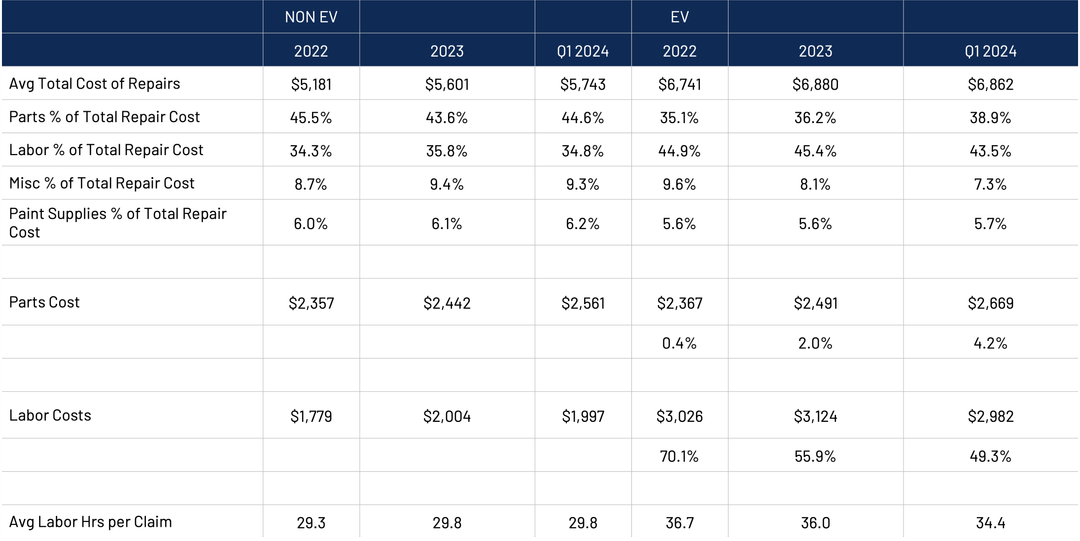
On average, labor costs were 49.3% higher per estimated repair on EVs in Q1, a slight decline from the average of 55.9% in 2023.
In 2023, the average time between last estimate and vehicle delivery grew to 52.3 days, nearly 12 days more than non-EVs. Getting the vehicle into the shop added 6.6 days and repairs required an additional 4.7 days.
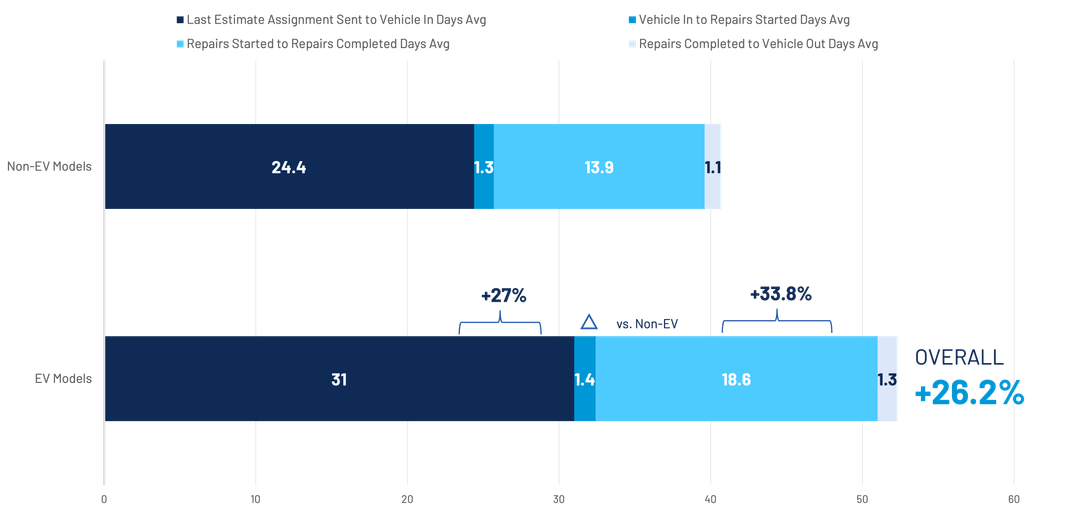
“Capacity within the burgeoning network of certified EV shops appears to be the basis for longer cycle times and the meticulous nature of procedures required to complete repairs,” the report states.
The full Crash Course report also covers auto physical damage, casualty, severe storms, and subrogation trends during Q1 2024.
Images
Featured image credit: Tivoly/iStock
Graphs provided by CCC.