
Enterprise: Length of rental continues decline in Q3 but challenges remain
By onAnnouncements | Collision Repair
Enterprise Mobility reports that the overall collision-related length of rental (LOR) dropped to 16.3 days during Q3, a decline of 1.2 days compared to Q3 2023.
“During 2022 and 2023, many factors affected the collision repair industry, including supply chain issues, parts delays, shifting workforces, and driving patterns,” the LOR report states. “However, we have observed most traditional patterns of LOR return to those last seen in 2021, albeit with overall results higher; in Q3 2021, LOR was 15.2 days.”
While LOR and repair times are on a downward trajectory, supply chain challenges have softened, and nearly 2 in 5 shops (38%) report they’re fully staffed and not looking to hire (the highest percentage since Q4 2020) is encouraging, Enterprise says other challenges remain.
“Significant weather events were prominent in Q3 2024, including hurricanes, flooding, severe weather, and hailstorms. We have also been tracking economic factors impacting customer behavior, such as increased premiums, higher deductibles, and claim-filing aversion — what
impact, if any, will this have on our industry and subsequent results?”
Ryan Mandell, Mitchell International director of claims performance, said several factors are converging to cause a reduction in repairable claims volumes, which aids shops in efficiently processing work in progress, according to the report.
Those factors include increased auto insurance premiums and average first-party deductibles.
Mandell noted that the Bureau of Labor Statistics reported the Motor Vehicle Insurance CPI increased in August by 16.5% over August 2023 and 0.4% over July 2024.
“Consequently, average first-party deductibles continued to rise in the 3rd quarter, with the U.S. reaching an average of $834 (up 20.7% compared to Q3 2023 and 1.1% compared to Q2 2024),” he said in the report.
Greg Horn, PartsTrader’s chief industry relations officer, said median parts delivery time decreased during Q3 mirroring Enterprise’s LOR data.
“Parts are a large influence on repair cycle time and Q3 2023 reflected higher delivery days for OE parts due to the United Autoworker’s strike,” he said in the report. “The U.S. collision repair industry and the economy in general were bracing for a potentially damaging Longshoremen’s strike, but the contract was temporarily extended, and the dock workers are back unloading cargo.
“Now we are focusing on measuring the impact of the hurricanes in the Southeast U.S. in the next quarter.”
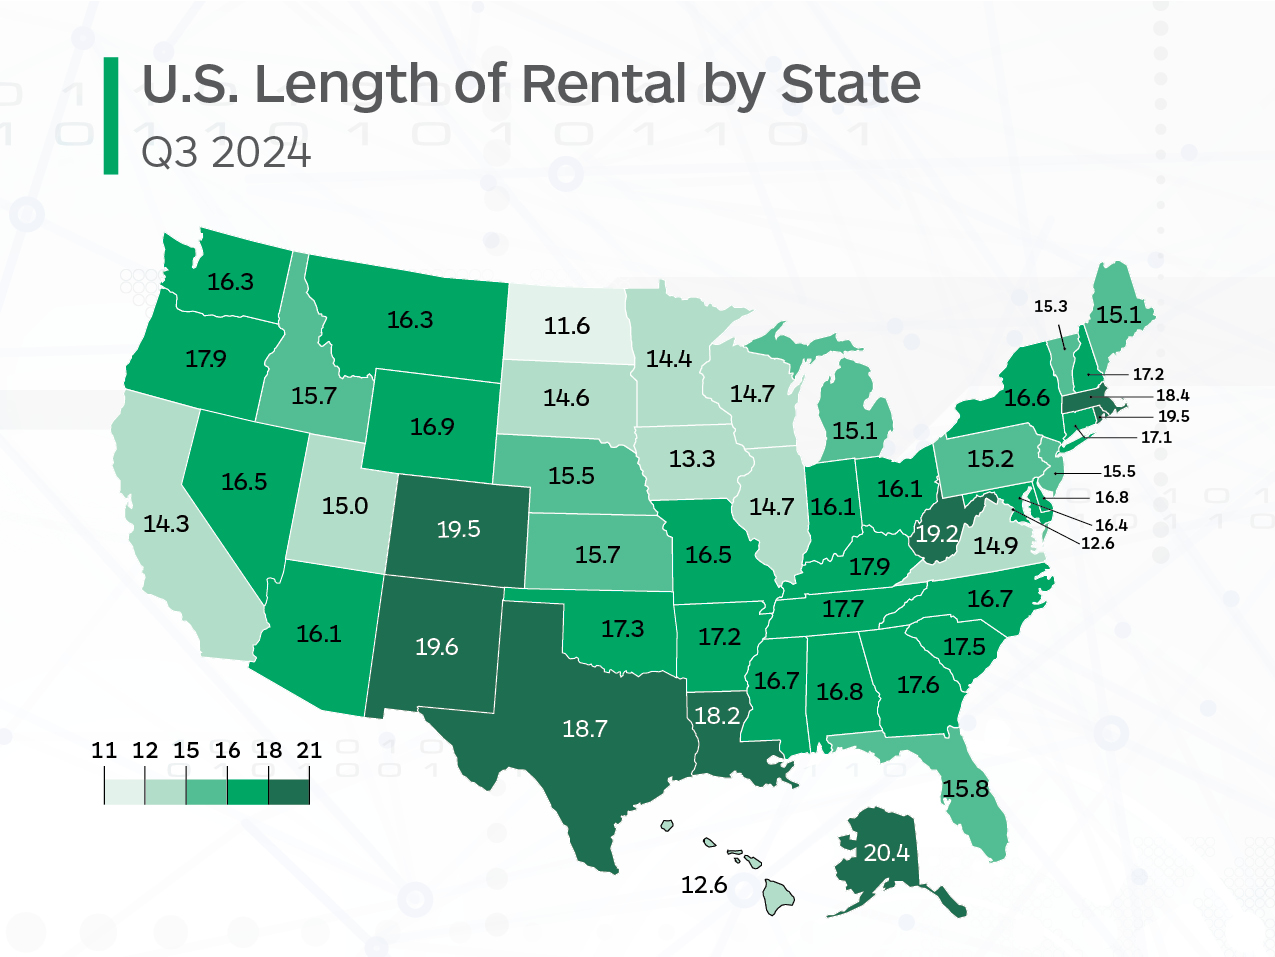
In Q3 2024, Alaska had the highest overall LOR at 20.4 days; however, it fell by 1.5 days compared to the same time last year. The next highest were Colorado and Rhode Island, both at 19.5 days.
North Dakota had the lowest overall LOR at 11.6 days, a 0.7-day decline from Q3 2023, followed by Washington D.C. and Hawaii at 12.6 days each.
Declines exceeded one day in 27 states compared to 33 states and D.C. in Q2 2024. Twenty states plus D.C. saw a decrease of less than one day compared to 15 states in Q2 2024.
“A continued decline in LOR could be, in part, based on shops’ ability to get repairs started more quickly than they could in 2022 and 2023,” said John Yoswick, editor of the weekly CRASH Network newsletter, in the report. “The national average backlog — how far into the future shops are scheduling new work — dipped to 2.6 weeks in July 2024, down by less than one day from the second quarter but 1.7 weeks shorter than a year earlier. It was the lowest average backlog of work in any quarter in the past three years.”
Yoswick added that insurer response time in reviewing supplements could also be contributing to lower backlogs and LOR compared to last year.
“While the improvement amounts to less than half a day, it marks the first year since 2019 that average wait times have declined at all,” he said. “Across all 12 insurance carriers asked about in CRASH Network’s survey in June, shops say they are waiting 4.9 days (on average) for an insurer to complete an in-shop inspection to approve supplements. That is down from the 5.4-day average reported in 2023, but still
well above the 2.9-day average wait time reported in 2018.”
In Q3 2024, drivable LOR was 15.1 days, down 0.6 days from Q3 2023. Compared to Q3 2021, LOR is flat at 15.2 days.
Alaska had the highest drivable LOR in Q3 2024 at 18.9 days while North Dakota had the lowest at 10.2 days.
Non-drivable LOR was 22.3 days in Q3 2024, a 2.7-day decline from Q3 2023. For comparison, non-drivable LOR was 21.9 days in Q3 2021.
Alaska had the highest non-drivable LOR at 30.4 days, however, a 2.1-day decrease occurred compared to Q3 2023. D.C. had the lowest at 18.1 days, representing a 3.0-day decrease.
Vermont was the only state that experienced a non-drivable increase, up 0.3 days to 27.1.
LOR for rentals associated with total loss claims was 14.9 days, a 1.7-day decrease compared to 2023.
“Total loss frequency is also increasing as vehicle values continue to gradually cool, with the U.S. reaching 20.6% in Q3 2024 (compared to 18.4% in Q3 2023),” Mandell said in the report.
West Virginia had the highest total loss LOR at 19 days while North Dakota had the lowest at 11.6 days.
Images
Featured image credit: Wavebreakmedia/iStock
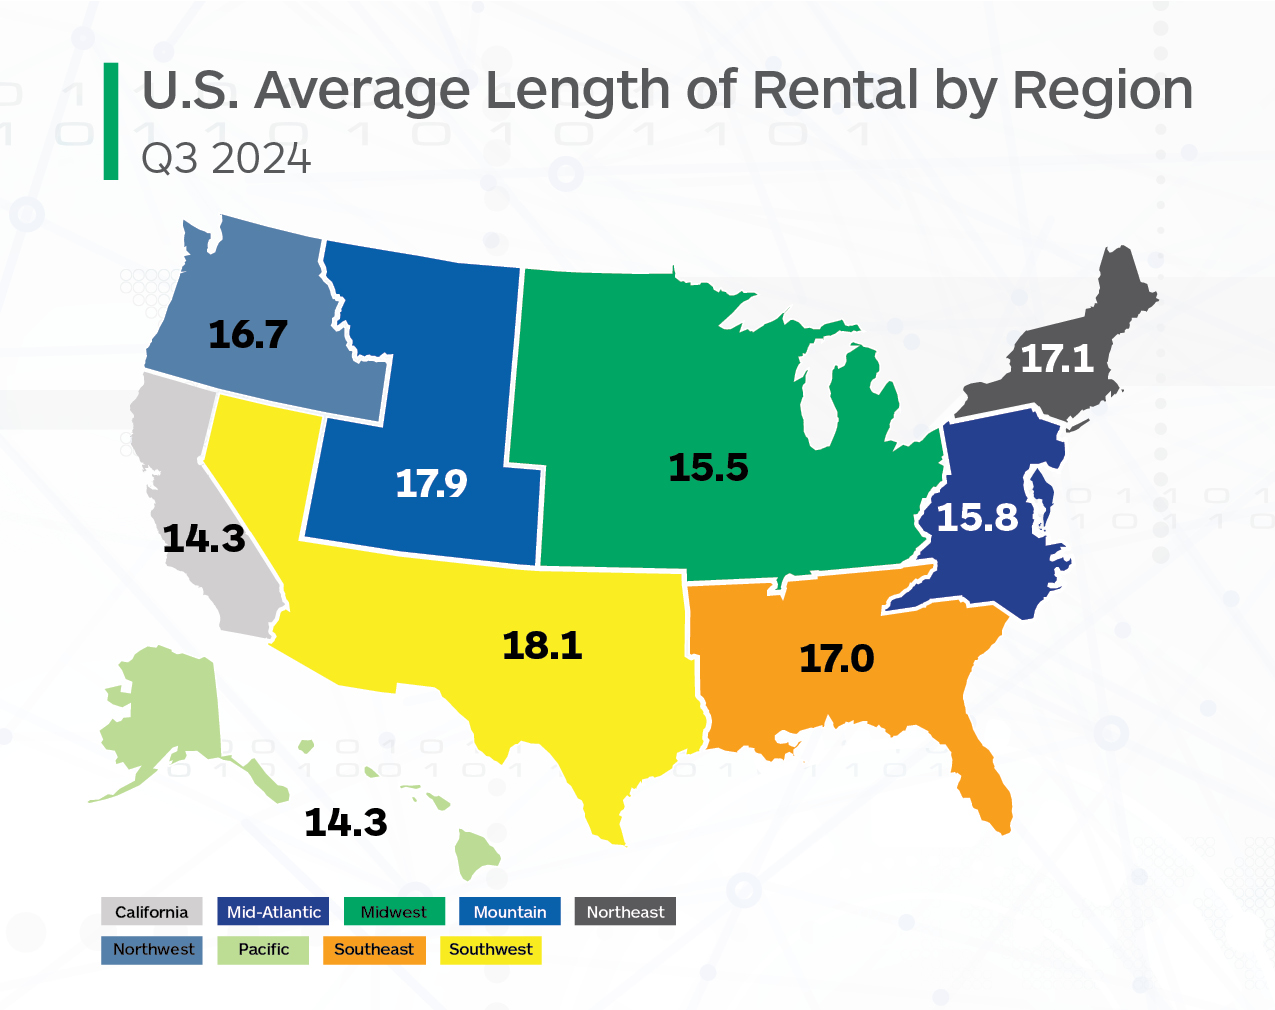
Graphs provided by Enterprise Mobility