‘Who Pays?’: Median frame rate $68, up from 2017
By onBusiness Practices | Insurance | Market Trends | Repair Operations
July “Who Pays for What?” polling of more than 500 shops found the median posted frame labor rate to be $68, an increase of $2-$3 over July 2017.
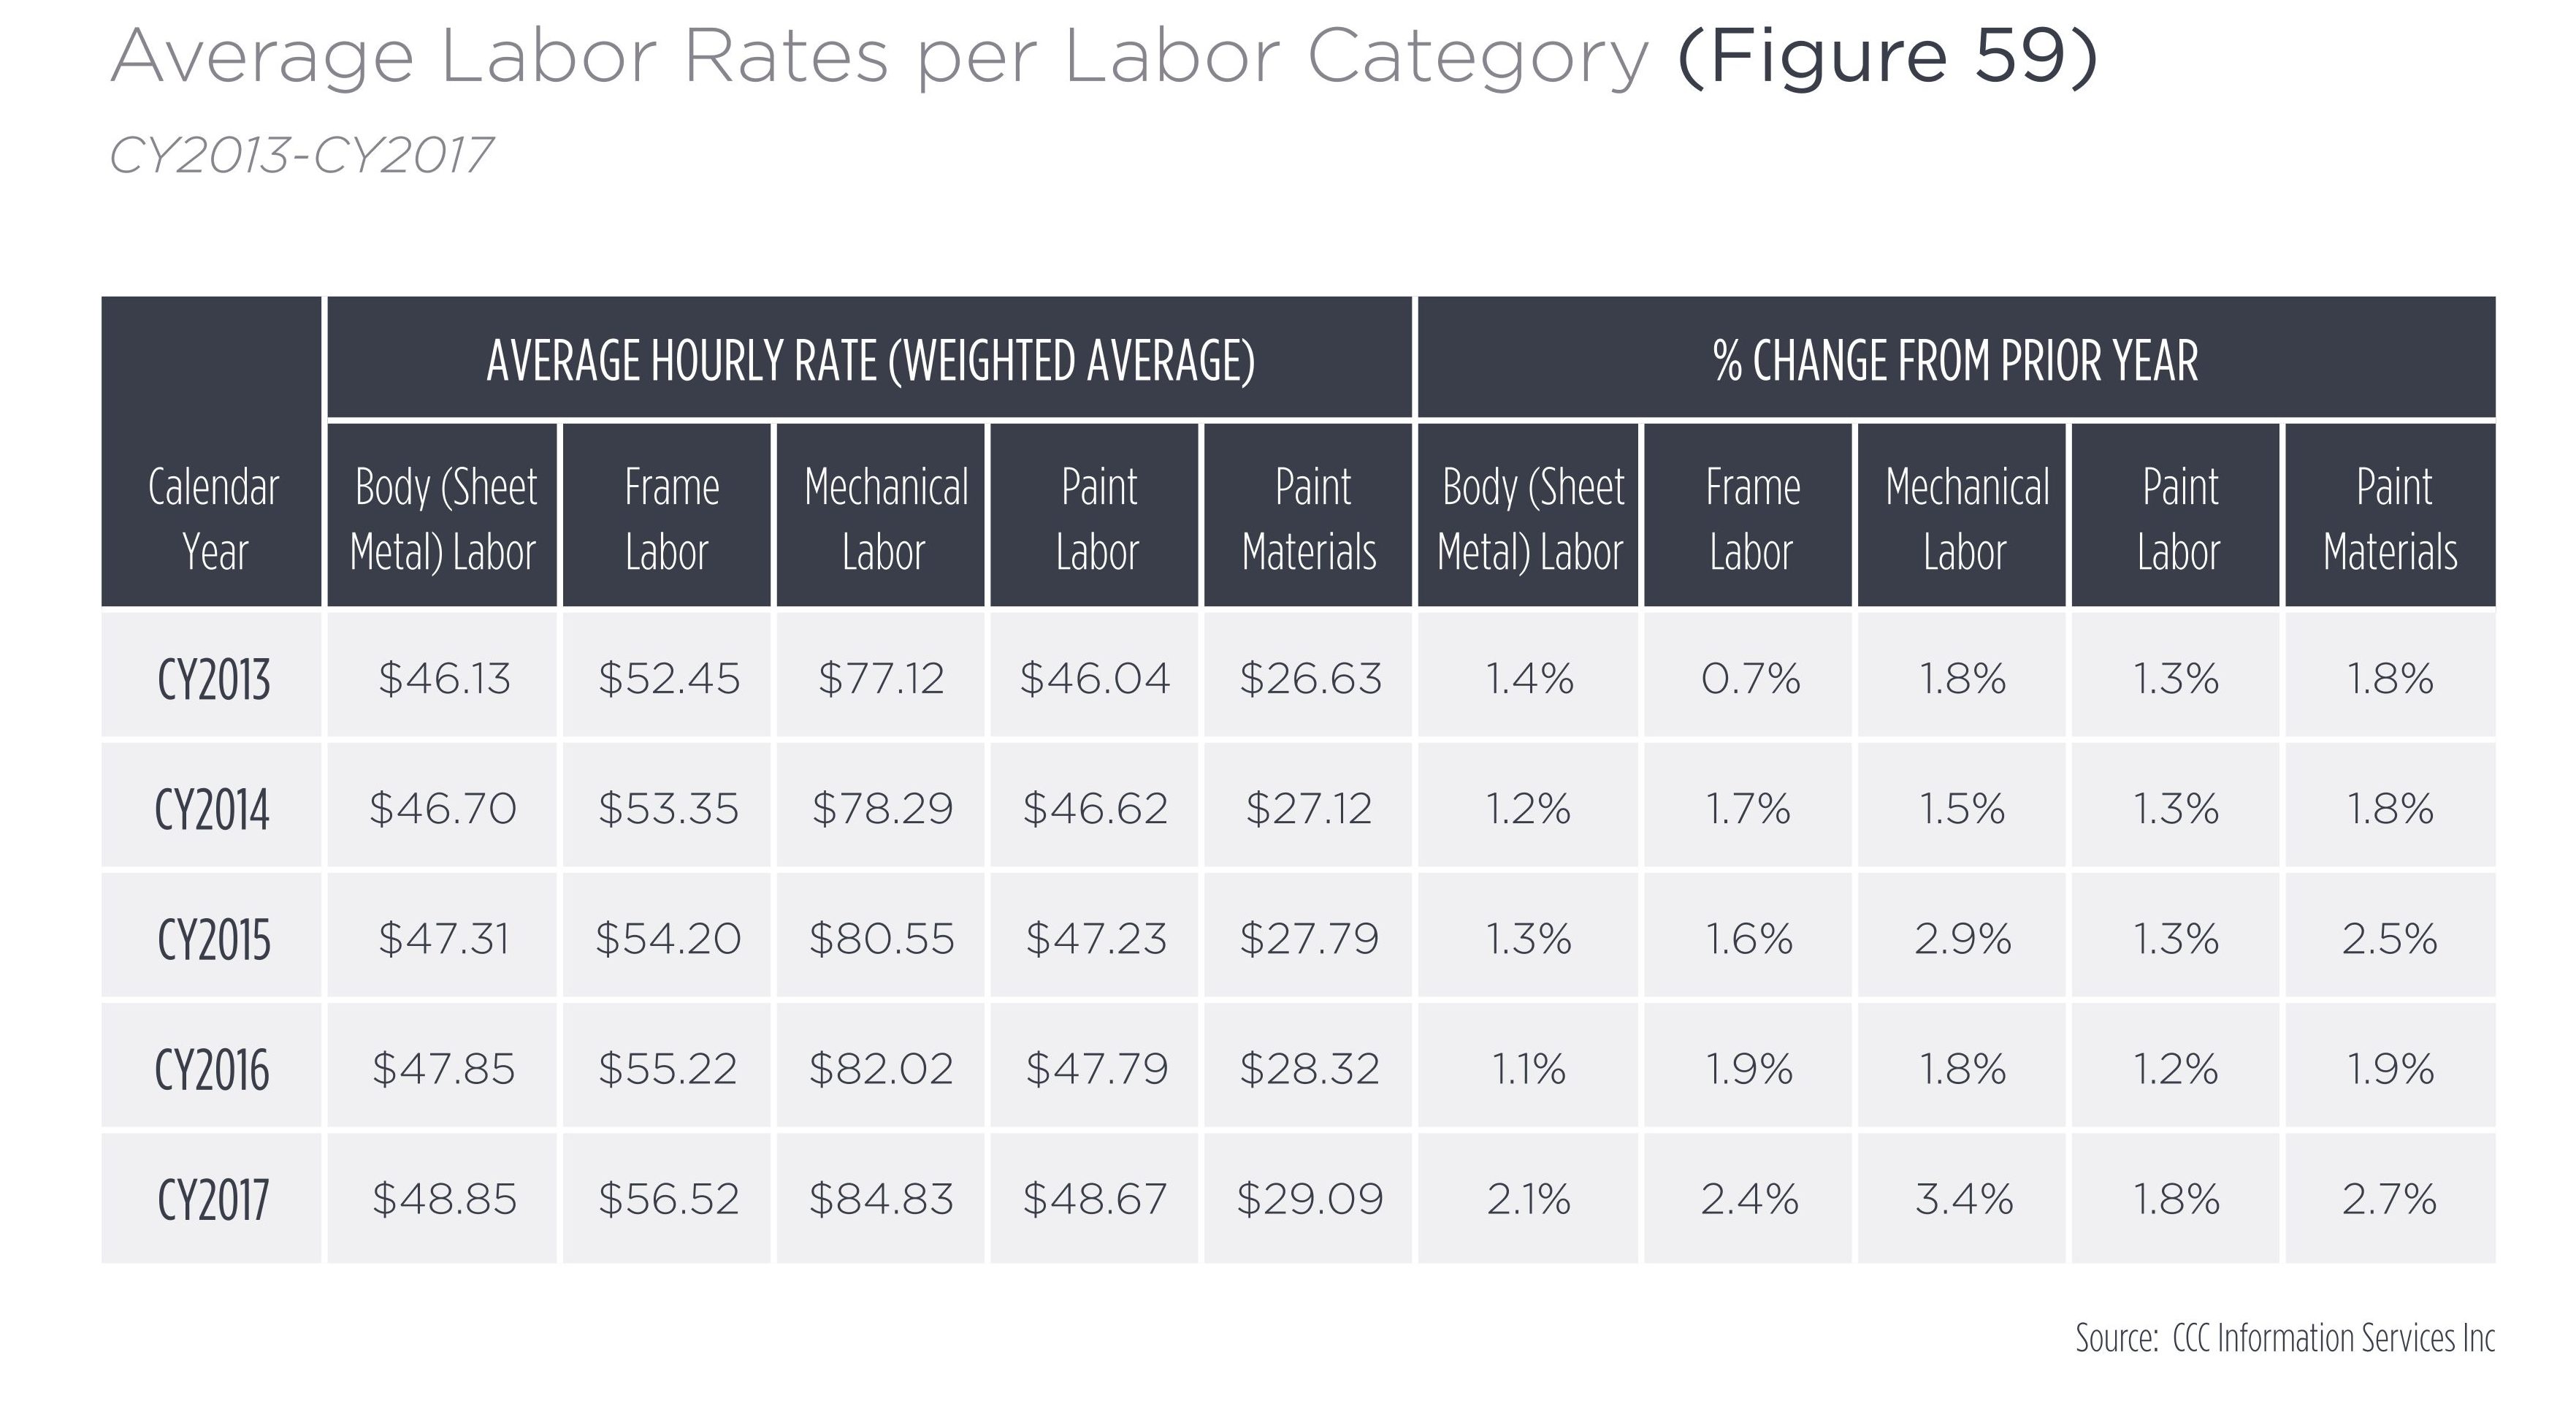
That’s higher than what CCC calculated was a weighted average $56.52 frame labor rate over the entire 2017 calendar year.
In fact, the “Who Pays?” research by Collision Advice and CRASH Network found at least 75 percent of the 503 responding shops describing a higher posted frame rate. The 25th percentile — a quarter of all shops’ rates fall below this number — in July 2018 was $60, according to the study.
The 75th percentile — a quarter of all shops charge more — held steady at $75, while all other percentiles rose $2-3 from 2017, according to the study. For the median, that’d be an increase of between 3 and 4.6 percent over the prior year.
The U.S. inflation rate from July 2017 to July 2018 was 2.9 percent.
CCC found the weighted average of frame labor jumped 2.4 percent in the full year of 2017 over 2016’s $55.22. The national inflation rate in 2017 was 2.1 percent.
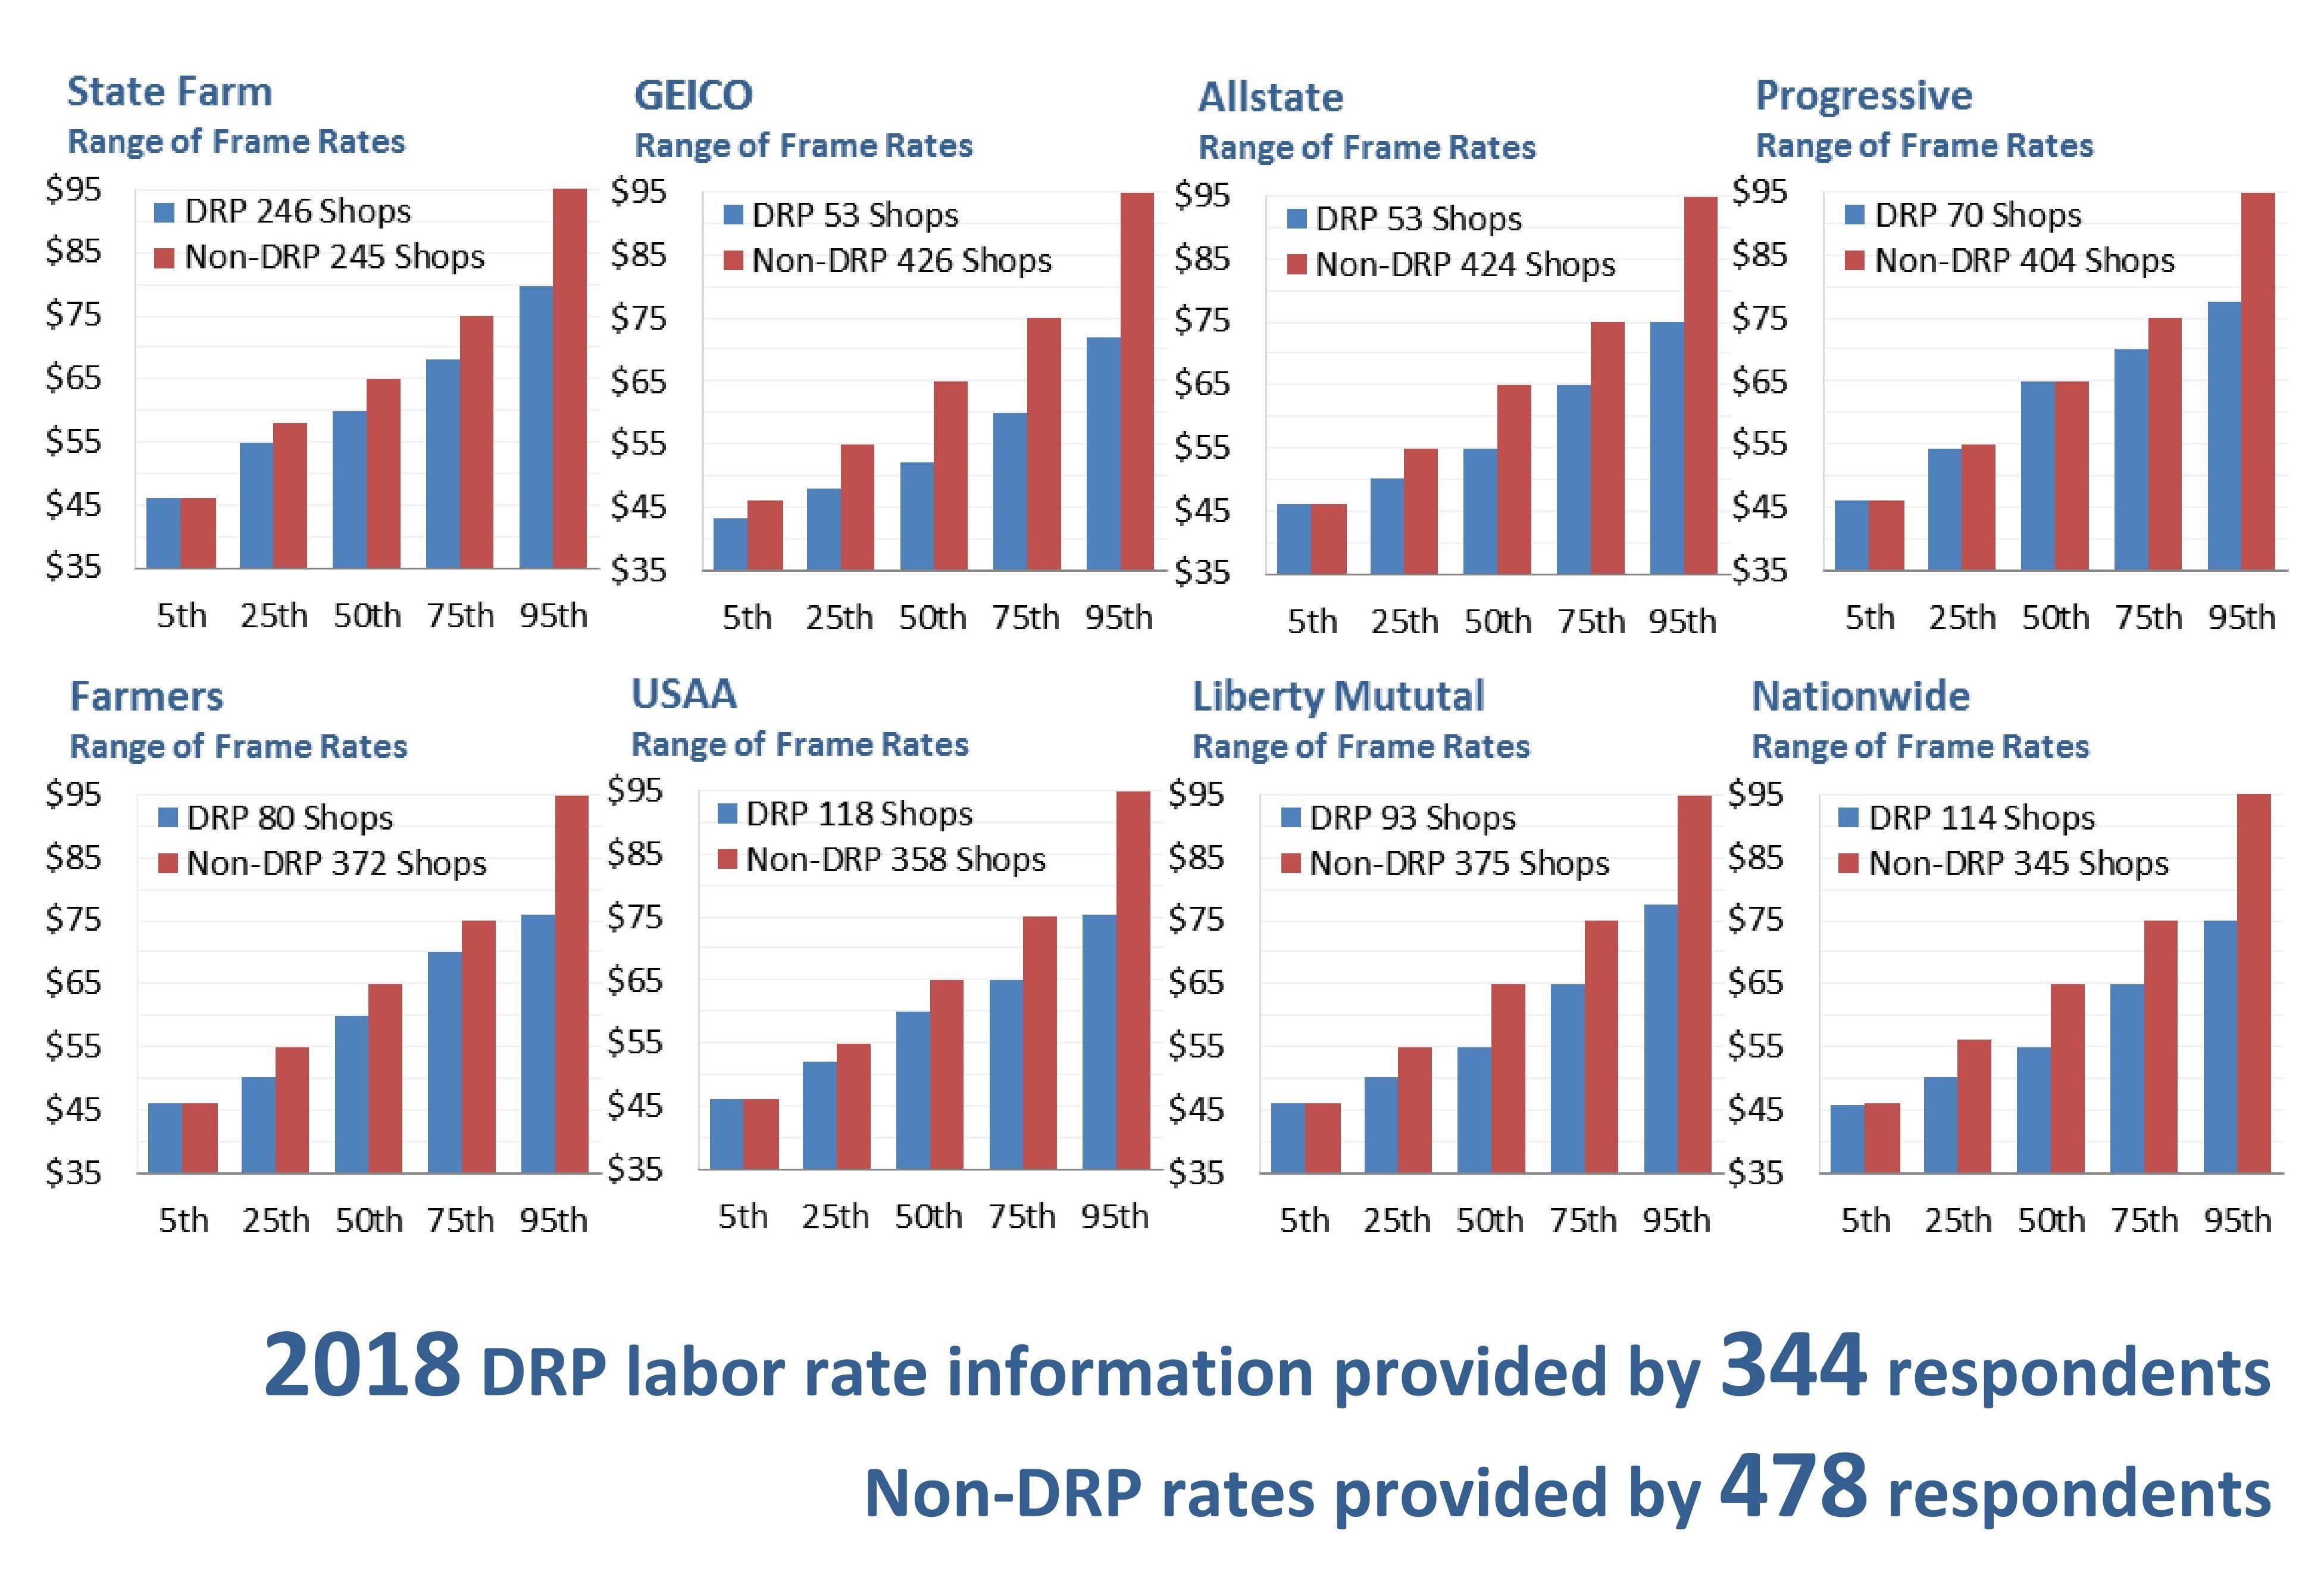
Looking at direct repair program and non-DRP shops for eight of the nation’s Top 10 insurers, the study found non-DRP shops making more on frame labor than DRP shops, largely across the board. According to the study, 344 shops contributed DRP data for at least one insurer, while 478 shops provided non-DRP rate data for at least one of the eight insurers.
The most comprehensive data came from State Farm, with 246 Select Service shops and 245 non-DRP shops reporting. The State Farm DRP median frame rate came in around $60, with non-DRP shops in the 50th percentile posting about $65.
By the 75th percentile — higher than 75 percent of shops — the DRP rate had risen to around $68, while the non-DRP rate reached the overall 75th percentile of $75.
Progressive is interesting because it appeared to have the lowest variation between what DRP and non-DRP shops were getting at the 25th and 50th percentile. Spreads at the 5th, 75th and 95th percentile seemed to be among the narrowest in the study as well. Seventy DRP shops and 404 non-DRP shops reported information.
Help the industry by taking the current “Who Pays for What?” survey on frame and mechanical operations here through Oct. 31. All answers are kept confidential — data is published only in the aggregate — and participants receive a copy of the report. Collision Advance and CRASH Network indicate the survey takes about 15-25 minutes and should be completed by “a shop owner, manager or estimator who is familiar with the shop’s billing practices and the payment practices of the largest national insurers.”
More information:
Take the 2018 aluminum, administrative procedures and shop supplies “Who Pays for What?” survey
July 2018 “Who Pays for What?” frame and mechanical work results
Images:
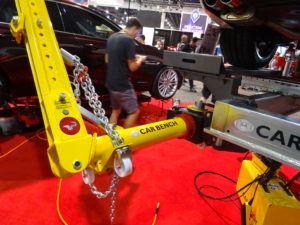
A Car Bench frame bench is shown at SEMA 2017. (John Huetter/Repairer Driven News)
CCC found the weighted average of frame labor jumped 2.4 percent in the full year of 2017 over 2016’s $55.22. The national inflation rate in 2017 was 2.1 percent. (Provided by CCC)
Looking at direct repair program and non-DRP shops for eight of the nation’s Top 10 insurers, the study found non-DRP shops making more on frame labor than DRP shops, largely across the board. According to the study, 344 shops contributed DRP data for at least one insurer, while 478 shops provided non-DRP rate data for at least one of the eight insurers. (Provided by Collision Advice and CRASH Network)