
See how auto body industry worked, earned during pandemic with CCC’s 2021 ‘Crash Course”
By onAnnouncements | Business Practices | Education | Insurance | Market Trends | Repair Operations | Technology
CCC on Wednesday released its annual “Crash Course,” and while the 2020 data might in some aspects capture a true outlier of a year, collision repairers should still hustle over and download the free industry resource.
The metrics and analysis within the document examines key trends in consumer behavior during the pandemic — including some which might stick around once life returns to normal. The publication by CCC director and lead analyst Susanna Gotsch also captures and discusses broader vehicle trends such as ADAS and connectivity, which absolutely will continue to develop.
“Crash Course illustrates how Covid-19 impacted our industry and the trajectory of change moving forward,” Gotsch said in a statement Wednesday. “CCC has published Crash Course for 26 years and this edition reveals unprecedented change. And though we expect some changes like miles driven to revert to pre-pandemic levels, we project other changes will become the new baseline as photos, mobile, AI, and customer demands have reset expectations and changed how we work.”
We’d also refer readers to what we affectionately call “The Big Chart,” which details a bunch of key industry statistics on factors like labor hours, rates and parts usage for repairable vehicles during 2020 and prior years.
The data draws from the vast pool of insurer and repairer estimates within CCC. It’s going to capture everything from initial insurer appraisals written for customers who then cash out to a repairer’s 100 percent teardown blueprint for a customer-pay vehicle. So it’s not necessarily an apples-to-apples comparison to your particular shop, estimate, or scenario. Nevertheless, it still offers repairers valuable context on vehicles, the industry and broader trends with both of them.
Also, there’s some information that’s more absolute and estimator-neutral, such as average repairable vehicle age or percentage of vehicles ultimately totaled.
Here’s a few highlights:
The average repairable vehicle estimate in CCC rose nearly $200 to $3,421, up 5.5 percent, and contained an hourly body rate up 1.6 percent to $52.27.
Repair represented the same 39.7 percent of the total repair bill as it did in 2019, but the hypothetical average shop captured here would have replaced 0.5 parts more than in 2019. They also put in an extra 0.4 hours of labor on a vehicle.
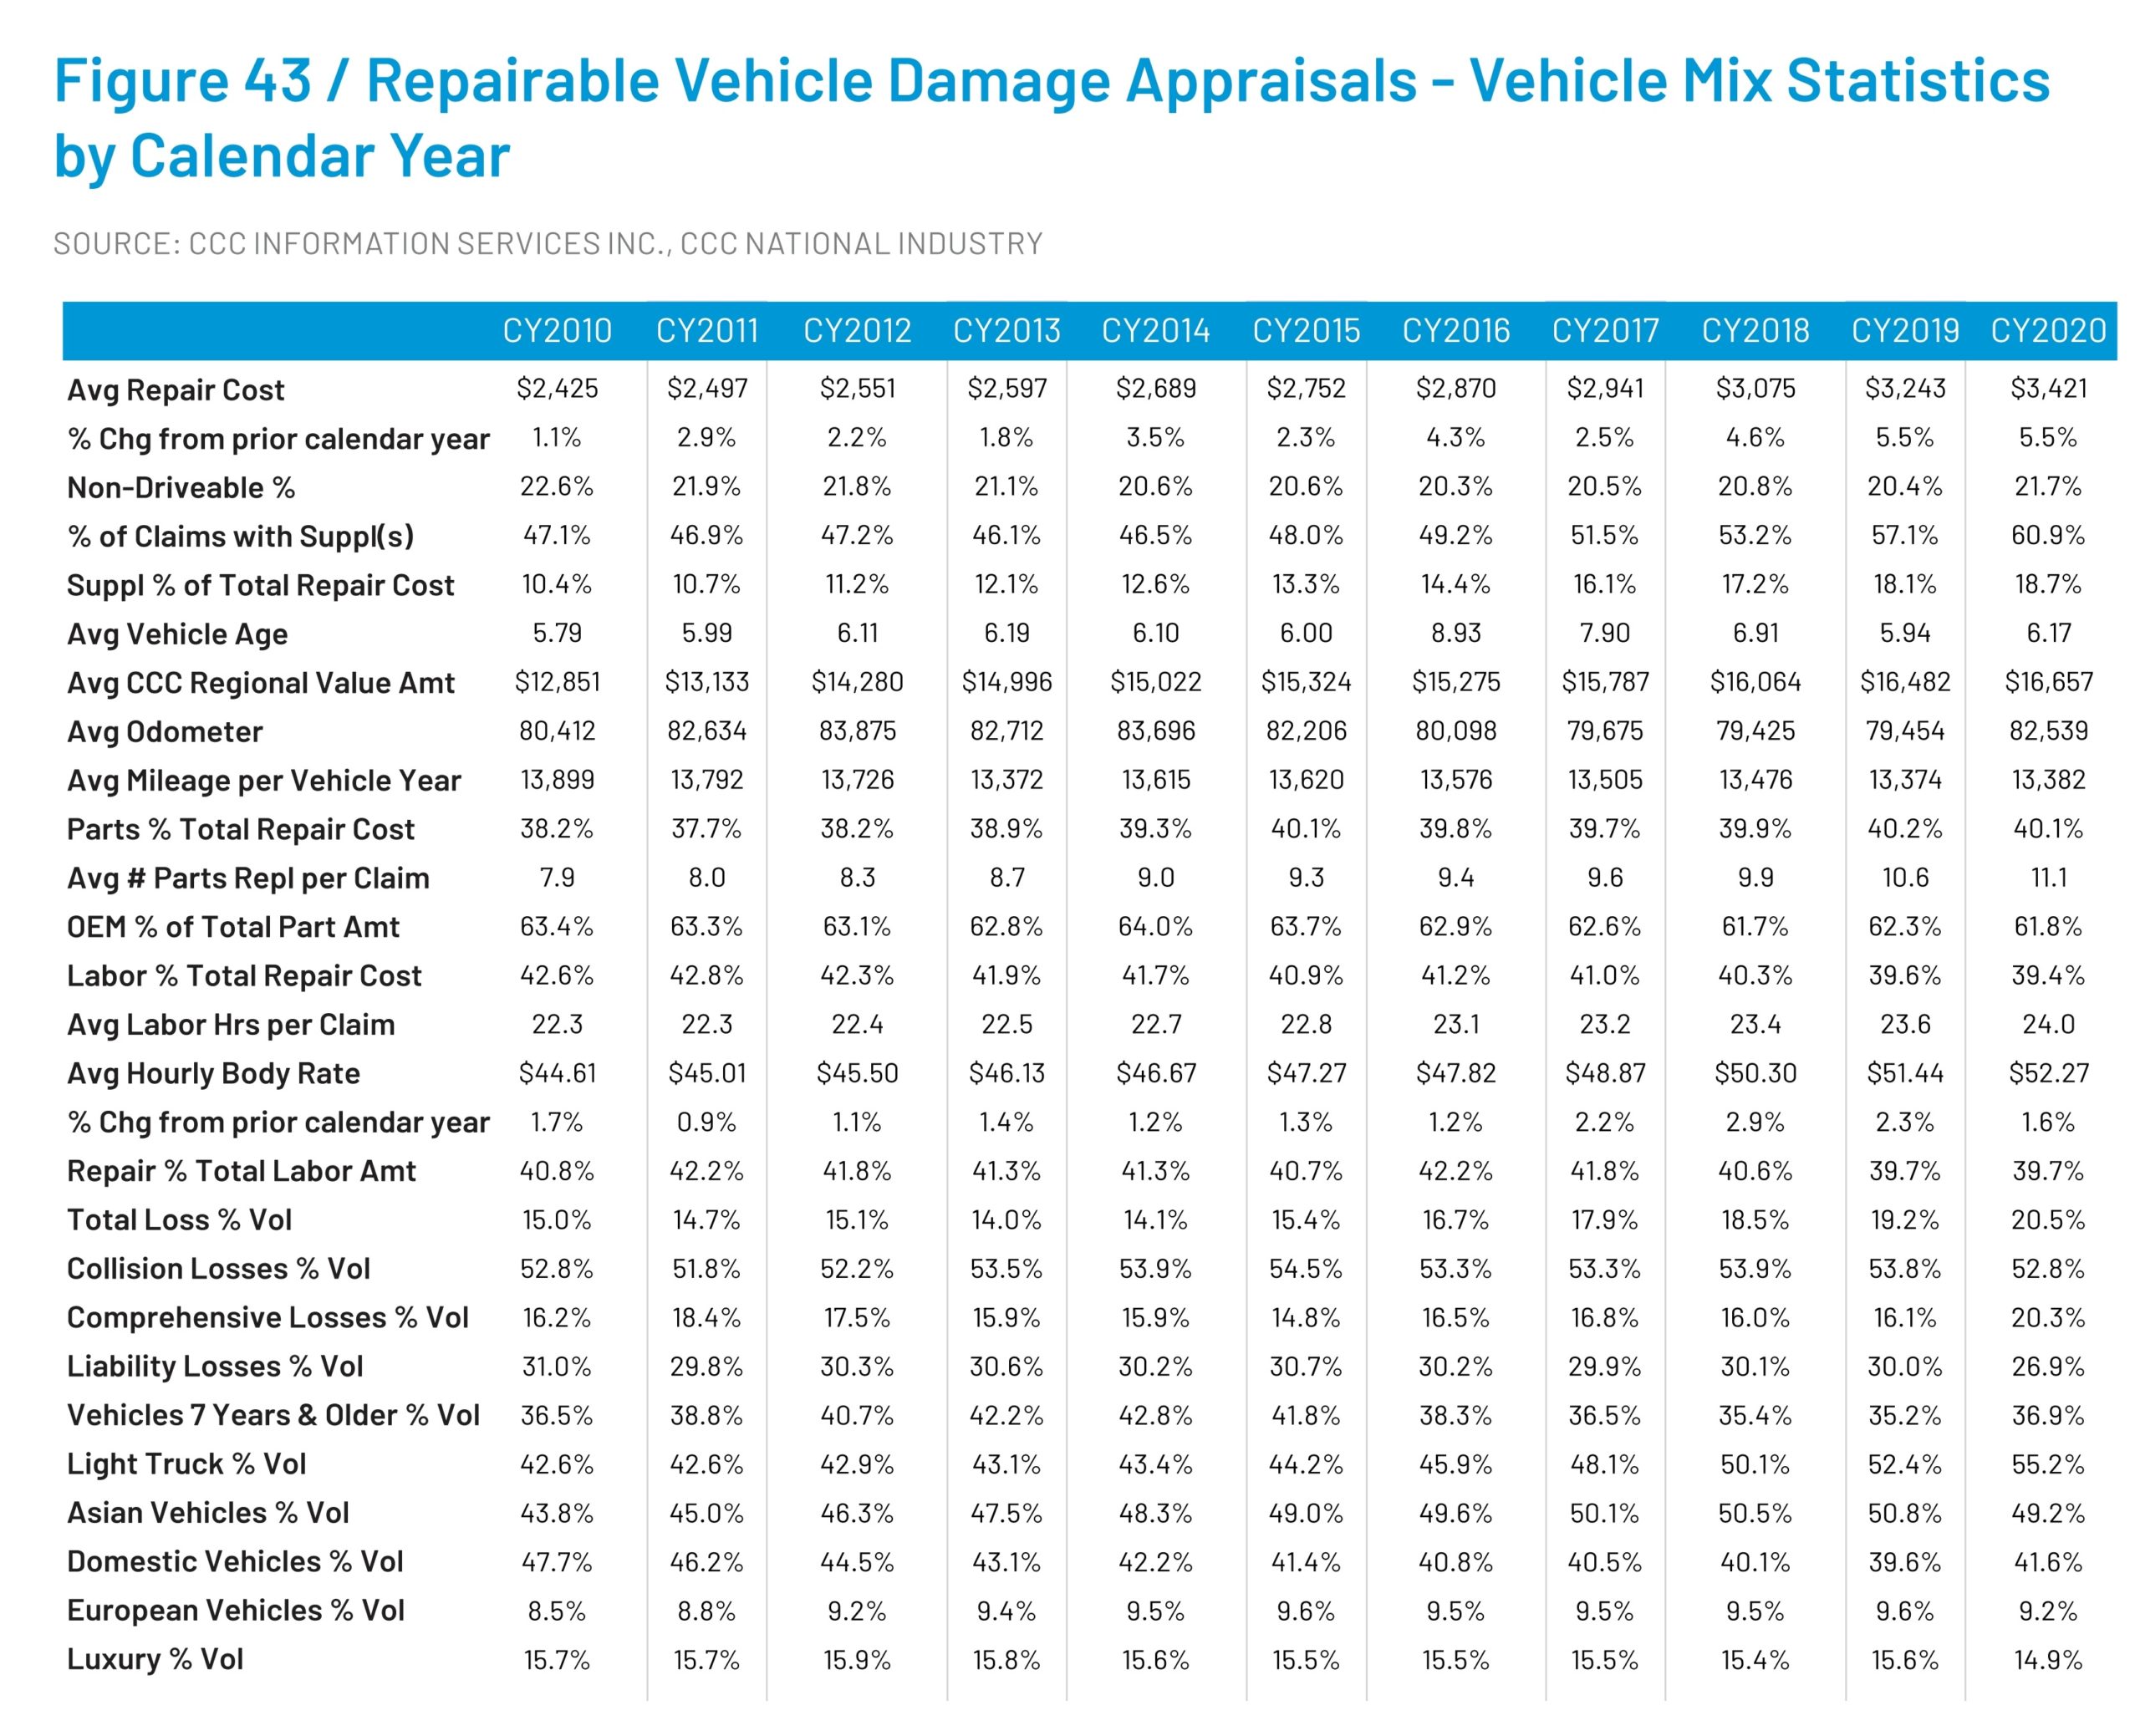
Supplements arose on 60.9 percent of claims, up from 57.1 percent. The average theoretical shop would have fixed a slightly older vehicle than in 2019, at 6.17 years. However, they also would have seen the total loss percentage climb more than 1 percentage point to 20.5 percent of appraisals.
As noted above, CCC also puts 2020 within the context of the past decade, both in that chart and in other deeper-dive analyses.
For example, repairers are encountering far fewer quick-fix repairable vehicles than before. In 2011, 27.4 percent of all repairable appraisals described 10 hours of work or less. By 2021, that percentage had fallen to 22.1. In 2019, it was also much lower, at 22.7 percent.
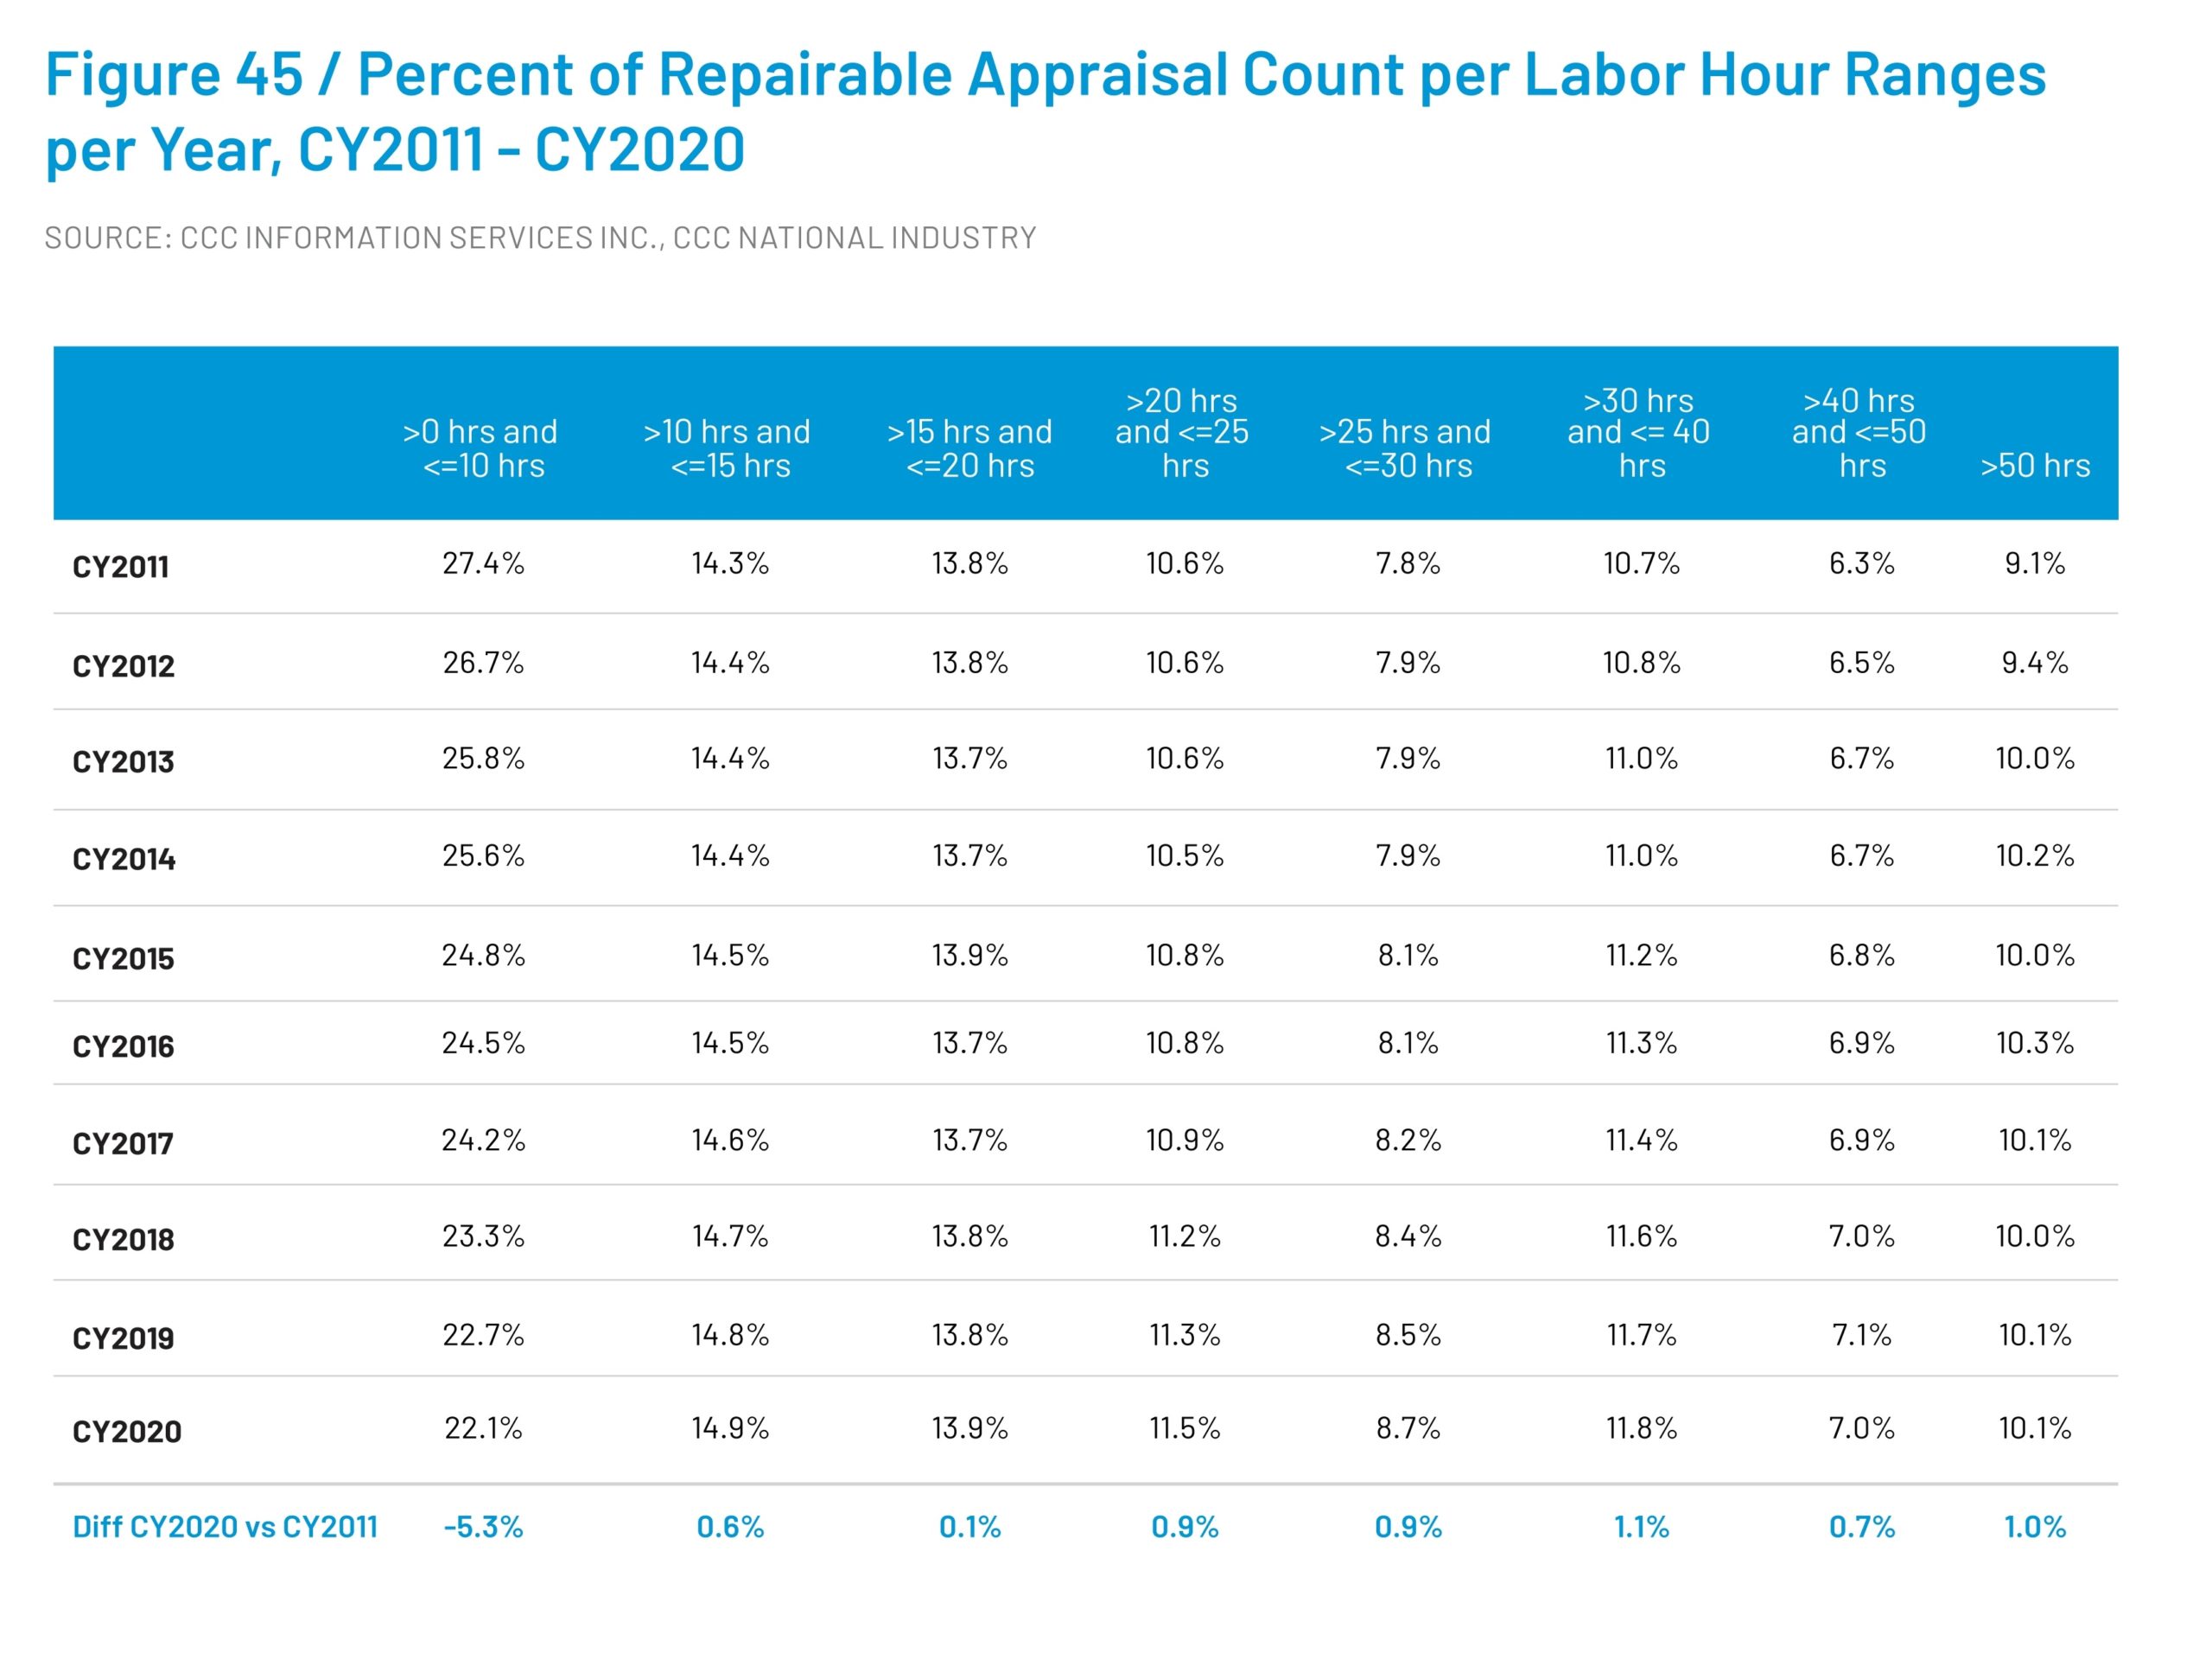 Meanwhile, the percentage of estimates needing more than 50 hours of work rose from 9.1 percent in 2011 to 10.1 percent in 2019 and 2020.
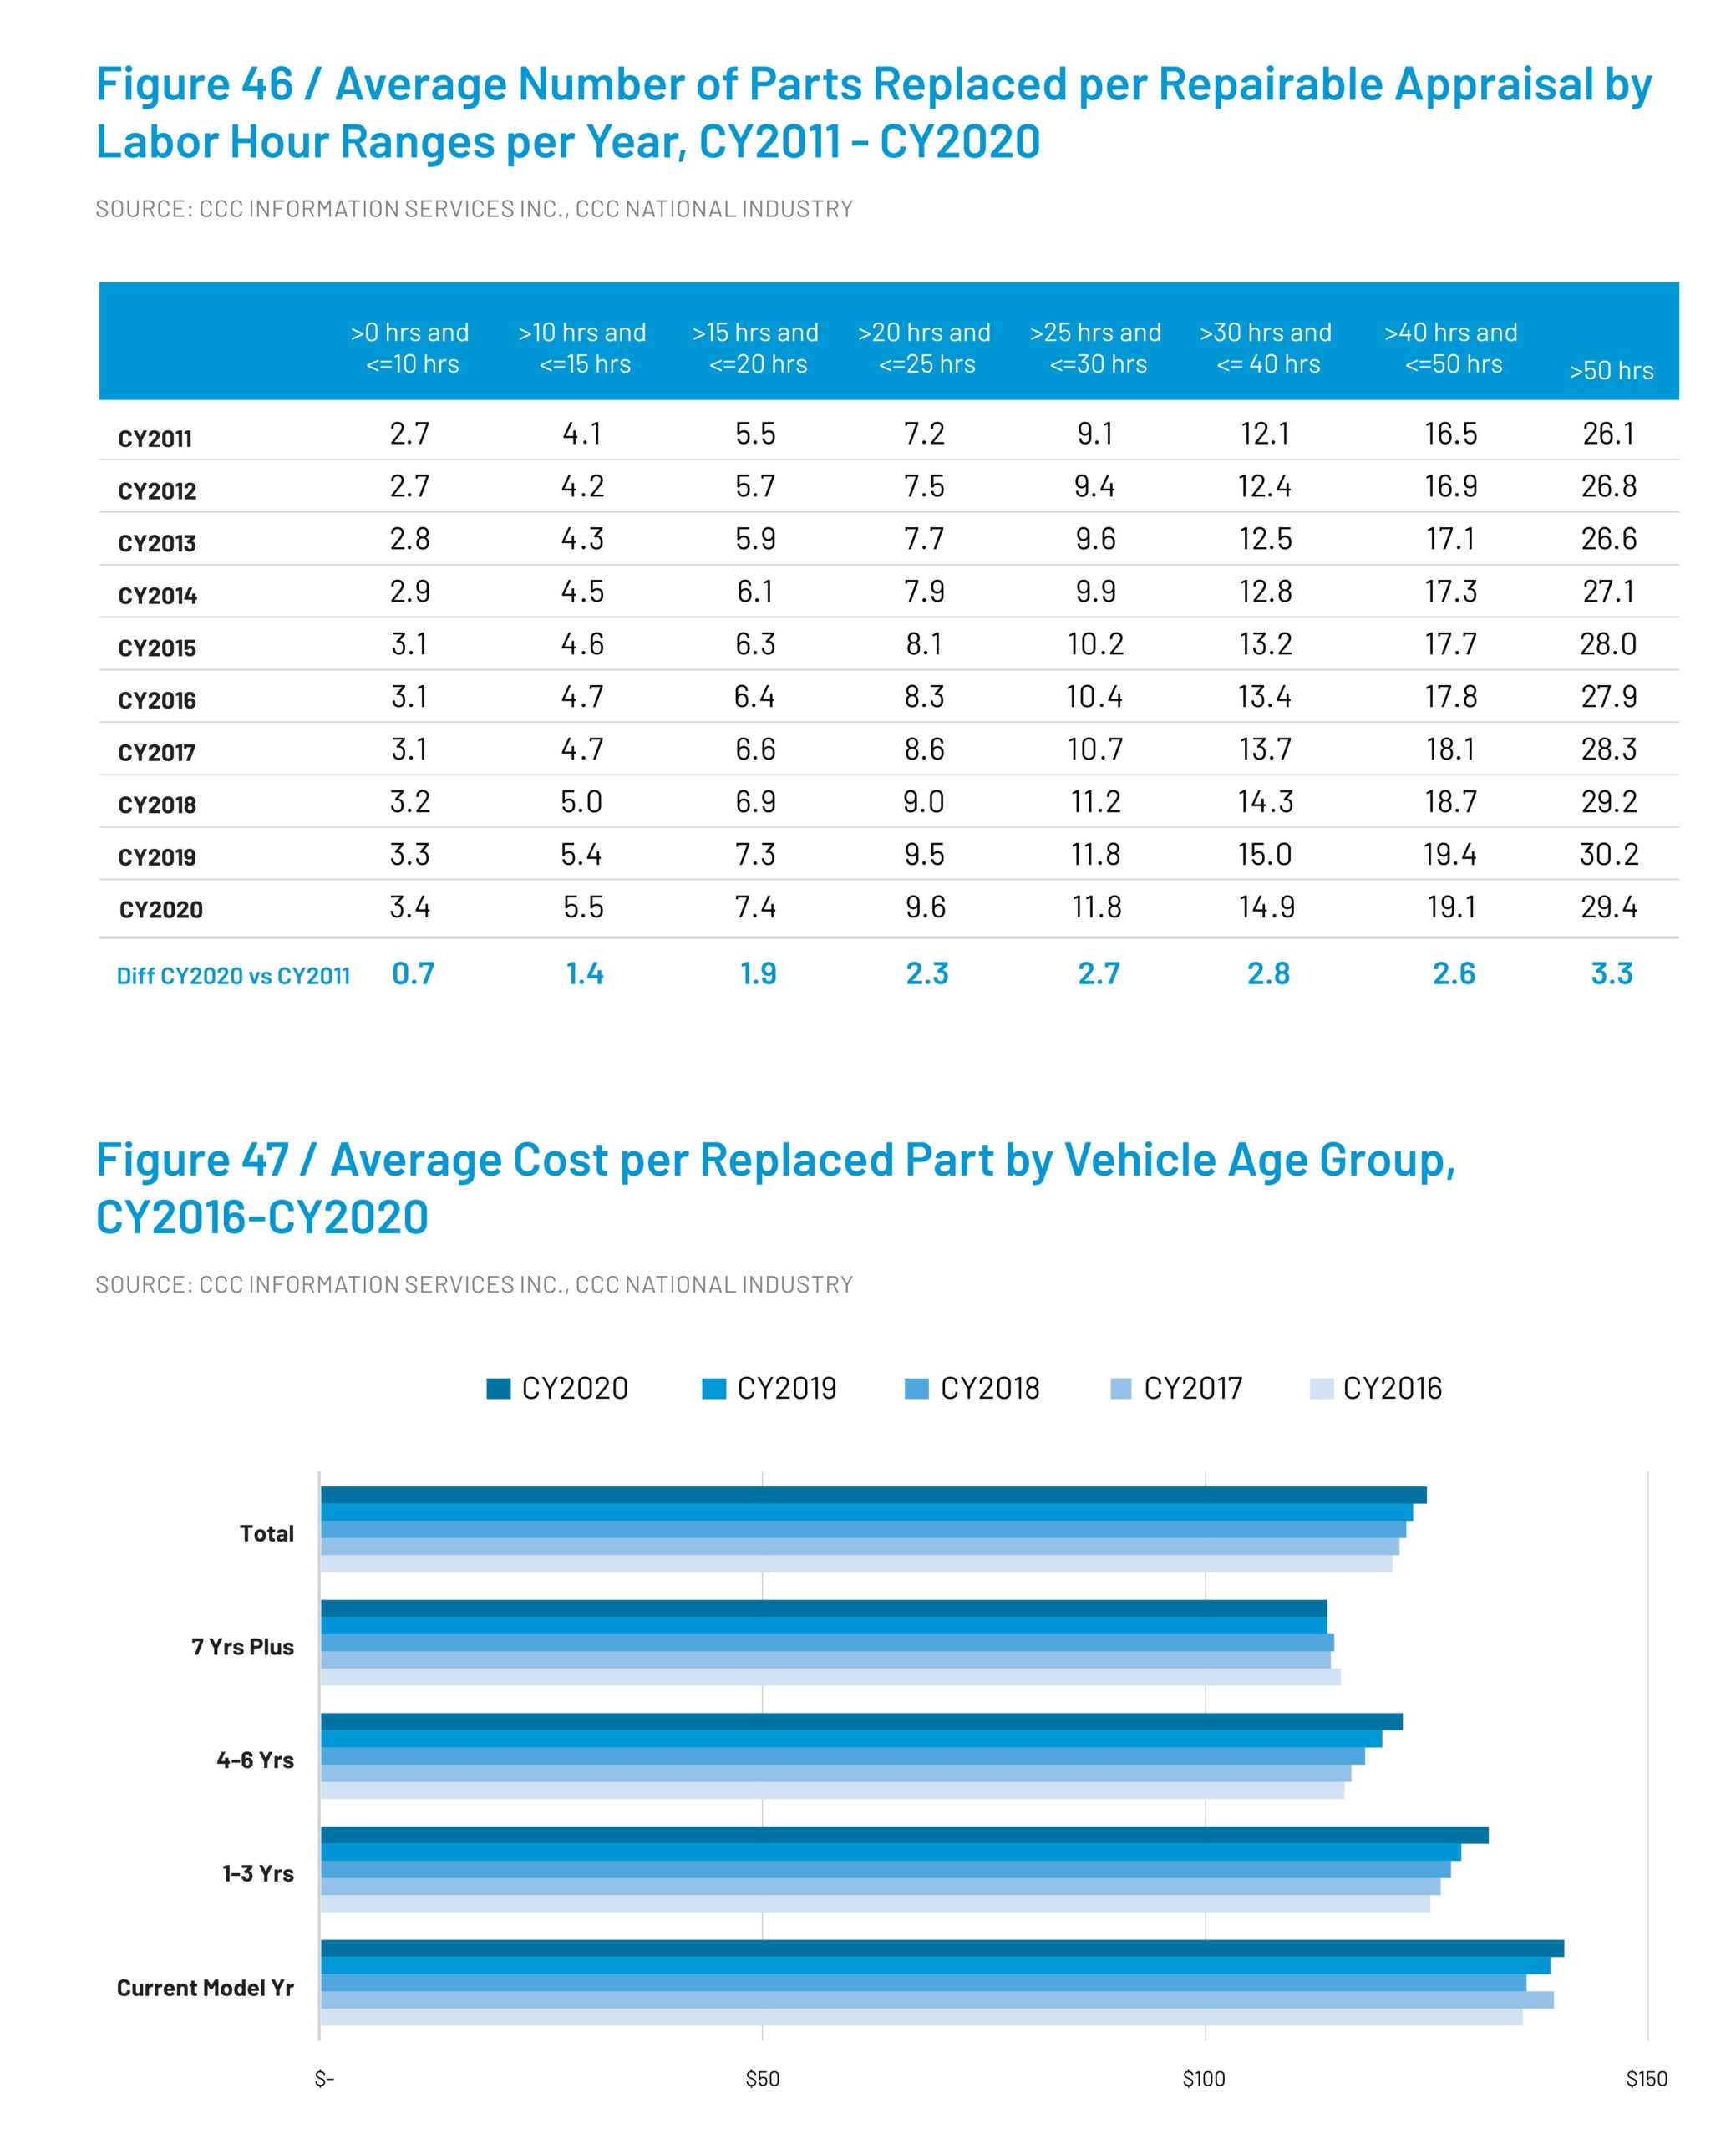
“Analysis of repairable appraisal data from CY 2011 to CY 2020 also shows the overall growth in the average number of parts replaced per claim and the average number of labor hours per claim,” CCC wrote. “Between CY 2011 and CY 2020, the percent of repairable appraisals with >0 and <=10 labor hours (including body, frame, mechanical and paint labor categories) fell by -5.3 percent, while those with 30 or more labor hours per claim increased nearly 3 percentage points.”
And CCC found more parts replaced on even the quickest repairs during that time. The average 2020 estimate with 10 hours or less of labor time still needed 0.7 more components compared to 2011. For 2019, the results were similar.
“Nearly three or more additional parts on average were replaced on appraisals with 30 or more labor hours per claim between CY 2011 and CY 2020,” CCC wrote. “Individual cost-per-replacement part has grown on average at least 1 percent annually over the last several years, but the average cost per part for current model year vehicles has been rising fastest, suggesting part prices in aggregate may rise further in the future.”
Download the 2021 “Crash Course” here, compare your shop’s experience, and think about what all of this means for 2021.
“CCC is committed to providing the industry with information and data to create more visibility into what’s ahead, informing understanding to positively impact business outcomes,” CCC wrote in a news release. It drew attention to “(k)ey topics” including:
• The rise of tech-enabled DIY customer experiences in insurance.
• How Covid-19 became the spark for consumers to take another look at usage-based insurance.
• Why 2020 saw more severe accidents and the impact on the repair process.
• Covid-19’s impact on the casualty claims process and healthcare.
• The role of vehicle technology in increasing repair costs.
More information:
“Covid-19 Massively Reshaped Trends and Behaviors Across the P&C Insurance Experience”
CCC, March 17, 2021
Images:
CCC director and lead analyst Susanna Gotsch was the author of CCC’s 2021 “Crash Course.” (Provided by CCC) (Photo: Heather Eidson)
CCC’s 2021 “Crash Course” offers context on collision industry trends, drawing from its vast pool of estimates. (Provided by CCC)
CCC’s 2021 “Crash Course” tracked a reduction in repairs which could be done in 10 hours or less between 2011 and 2021. (Provided by CCC)
CCC’s 2021 “Crash Course” tracked an increase in the number of parts replaced in the various years between 2011 and 2021. (Provided by CCC)