
PCIAA R.I.-neighbor comparisons remain dubious in latest attack on ABARI
By onAssociations | Business Practices | Insurance | Legal | Market Trends | Technology
Confronted with a bill that would require consumer choice of parts for the first four years of vehicle life and OEM repair procedures, the Property Casualty Insurance Association of America has issued yet another analysis promising financial ruin.
Like similar efforts in 2015 and 2017, it’s apparently aimed at scaring legislators, consumers and media who don’t want to look past the impressive-looking but dubious arguments.
Fortunately, Repairer Driven News has done that work for you. Here’s why some of these Chicken Little forecasts might not be anything to worry about for Rhode Islanders evaluating Senate Bill 2679 and the companion House Bill 8013.
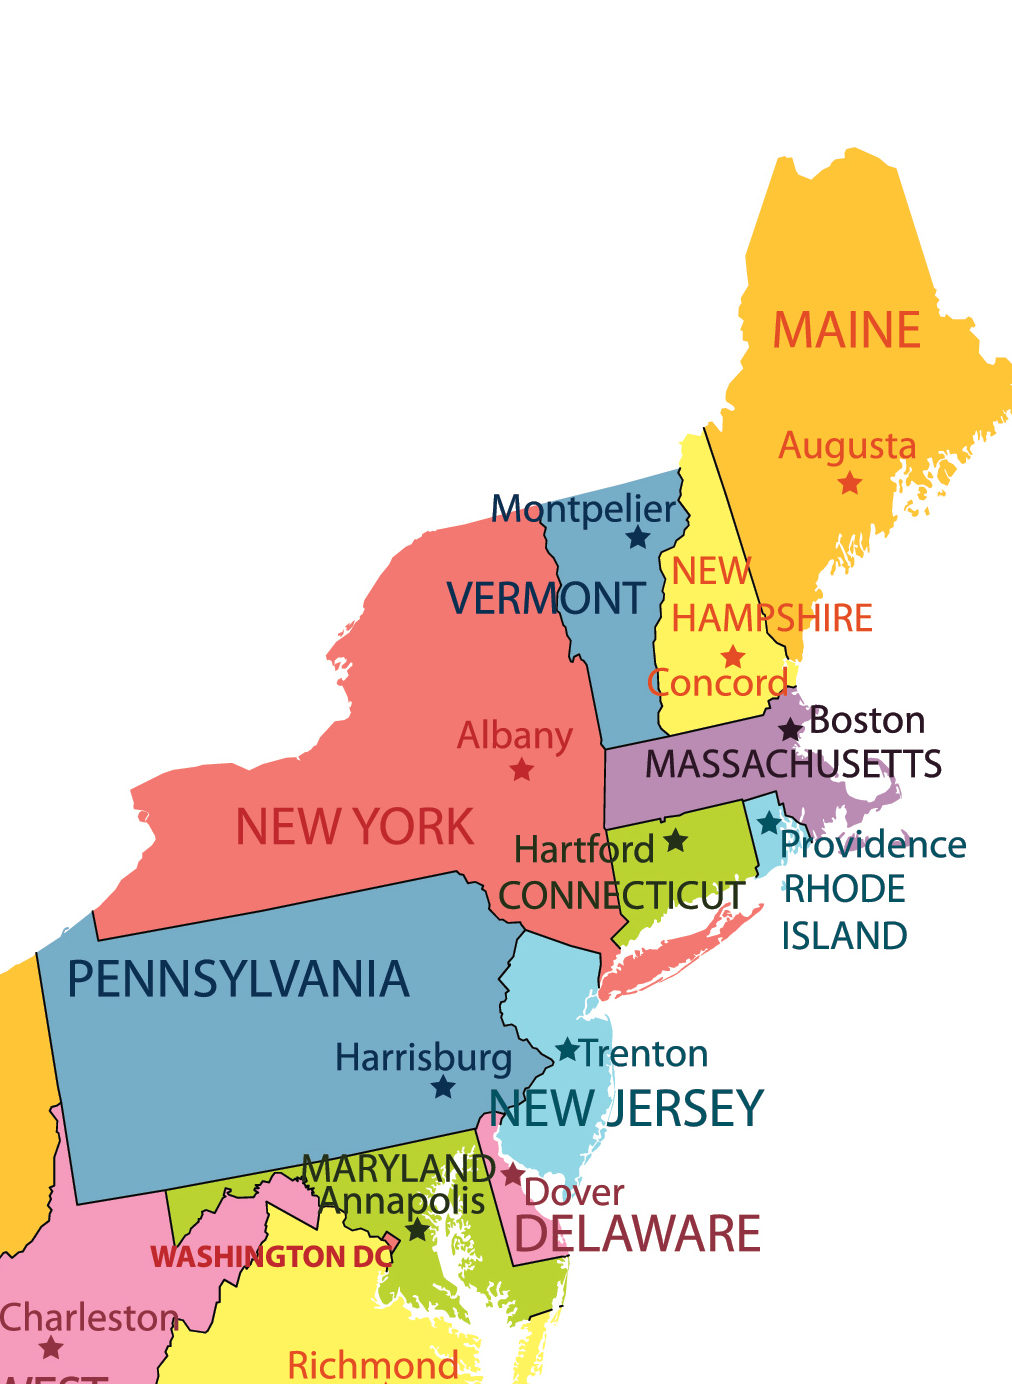
Rhode Island is just like Maine? And where’d New York go?
The PCIAA bases a large part of its analysis on comparing Rhode Island to five neighboring states: Connecticut, Maine, Massachusetts, New Hampshire and Vermont. We noted back in a 2015 edition of this report that it appeared to be cherry-picking them — and the problem is even worse today.
As the National Association of Insurance Commissioners writes in its most recent annual report of premium costs, state-to-state comparisons on auto insurance matters aren’t always a great idea:
Aggregate written premiums and aggregate written exposures are used in calculations with no distinction as to policyholder classifications, vehicle characteristics, or the selection of specific limits or deductibles, all of which significantly impact the cost of coverage. Nor do the results consider differences in state auto and tort laws, rate filing laws, traffic conditions, or other demographics.
CAUTION: Because of these differences, direct comparisons between state results should be treated with a high degree of caution. (Emphasis NAIC’s)
Oops. But that didn’t stop the PCIAA from trying. And as we find, the states it chose suggest even more caution might be needed.
The NAIC specifically singles out per capita highway miles driven, disposable income, and population density as being correlated with higher insurance premiums, which makes sense if you think about it. Richer people in denser states driving more are bound to generate more crashes with nicer cars; therefore, insurers need to set premiums accordingly to meet this frequency and severity.
Based on this, it seems apples-to-oranges to compare Rhode Island to New Hampshire, Vermont and Maine. A much more appropriate nearby trio would have been Pennsylvania, New Jersey and Delaware — but as we’ll see, they had higher premiums and claims costs than the three northeastmost states, and likely would have harmed the PCIAA’s analysis.
It gets even worse. In 2015, the PCIAA included a sixth state — New York — in its comparison, which was appropriate as New York resembles Rhode Island in the factors mentioned by the NAIC.
But by 2018, New York apparently didn’t produce data helpful to the PCIAA’s argument, and it was unceremoniously dropped from the report.
Here’s why the PCIAA state selection is methodologically shaky when exposed to the three factors the NAIC says are correllatable to premiums:
All Rhode Islanders live in urban areas, according to the 2010 Census data provided by the NAIC in its 2018 report. That’s on part with Massachusetts (99.6 percent), Connecticut (91.4 percent) and New York (91.9 percent).
But it’s way off from Vermont (33.8 percent), Maine (58.4 percent) and New Hampshire (62.2 percent). Again, New Jersey (100 percent), Pennslyvania (84.1 percent), and Delaware (78.8 percent) might be more relevant.
The same problem happens when you look at Federal Highway Administration miles driven in 2014, the statistic offered by the NAIC. Rhode Island sees 1.27 million miles driven per mile of road. Again, not too far from Massachusetts (1.58 million), New York (1.13 million) or Connecticut (1.45 million). But again, New Jersey (1.92 million), Pennslyvania (0.83 million) or Delaware (1.50 million) might be more appropriate than Vermont (0.5 million), Maine (0.62 percent) or New Hampshire (0.8 million).
Bureau of Economic Analysis 2014 disposable income data in the NAIC report is less clear-cut, but one notes that Maine ($37,049) is by far the poorest of the states, and seems to be 3-for-3 a poor choice for the PCIAA to use.
Rhode Island ($42,585) here is close to Pennsylvania ($42,414), Delaware ($40,256) and Vermont ($42,267), with Connecticut ($56,186), Massachusetts ($50,366), New Hampshire ($48,280), New Jersey ($49,983), and New York ($47,446) further away.
Using New Hampshire, Vermont, and Maine and ditching New York allows the PCIAA to compare Rhode Island to nearby states with lower premiums and claim costs (more on this shortly). Lawmakers and consumers should keep this silly, self-serving methodology in mind when evaluating the PCIAA’s claims of Rhode Island statistics out of whack with its neighbors.
For Rhode Island’s premiums really aren’t that bad when you draw more legitimate state-to-state comparisons in the Northeast. The combined average premium (policyholders who have liability, collision and comprehensive) in Rhode Island was $1,257.38 in 2014, the last year with NAIC data available.
That’s behind New Jersey ($1,379.20) and New York ($1,327.82) and close to Delaware ($1,215.69), Massachusetts ($1,107.76) and Connecticut ($1,132.78) — all states we’ve argued have similar demographics. Against Vermont ($746.79), New Hampshire ($795.50) and Maine ($689.12), Rhode Island certainly does look much scarier.
The PCIAA uses Fast Track data from 2014-17 to show collision and property damage liability severity is much higher in Rhode Island than the five states the association used as comparisons. Rhode Island’s severity combined was $4,130, 26 percent higher than those states, it reports.
The NAIC used to annually report average repair costs per state using data from Automatic Data Processing and Audatex, However, it said in its 2018 report these statistics are “no longer publicly available,” and we’re out of luck for 2014-15.
However, using ADP-Audatex’s 2017 data provided to the NAIC, Rhode Island’s average repair cost was $3,325 in 2013.
Maine ($2,378), New Hampshire ($2,236) and Vermont ($2,500) on the whole come in lower than New Jersey ($2,783), Pennsylvania ($2,542) and Delaware ($2,436) New York, so conveniently discarded by the PCIAA, was $3,278. Connecticut was $3,046 and Massachusetts $2,297. Nationwide, the average cost was $2,588.
While Rhode Island’s costs are certainly higher than everyone else, the PCIAA’s state selection again seems to be distorting the degree by which they are.
Finally, let’s not freak out too much over severity. The carrier always has the “out” of simply totaling the car if the bill reaches a particular threshold, which restricts the possibility of price gouging insurers claim shops and OEMs will do. The industry’s actuaries know this maximum risk — a few minutes with a Kelley Blue Book will give you the answer — and can adjust premiums accordingly to hedge for it. Thus, severity and premium cost is ultimately capped by the insurance industry regardless of whatever the PCI is claiming ABARI is doing in the Legislature.
That’s a margin?
The PCIAA also makes the ridiculous assertion that body shop margins have grown in relation to its dubious selection of states by comparing the growth in Rhode Island labor rates to technician hourly wage.
“In fact, the shop-owners’ margins, measure by the auto body repair labor rate less the average hourly wage, increased 11.2% in Rhode Island,” the PCIAA wrote. “This is far higher than the average 0.9% increase seen across neighboring states.”
The rate a body shop charges isn’t all pure profit after the body or paint technicians are paid, as the PCIAA and its members certainly know. That’s a gross margin on labor, not net profit. That’s like us subtracting an insurer’s payroll from its premiums and declaring the rest to be the insurer’s net profit margin. It’s utter nonsense, and carriers’ finance departments should be embarrassed to have their name associated with the report.
All of the shop’s overhead — training, equipment, non-production labor, real estate, infrastructure, keeping the lights on, taxes and business liabilty insurance — also must be recouped, primarily from its labor markup. Automotive News’ sister Fixed Ops Journal in October 2017 cited a National Automobile Dealers Association Academy recommendation that the service department have a 73 percent gross profit on labor to stay afloat and make money.
The fact that Rhode Island gross margins are increasing compared to neighboring states could stem from a variety of factors, including the cost of doing business in that state (both cost of living and regulatory demands) or simply that Rhode Islanders are better businessman and not running their companies on a shoestring budget.
After all, It’s not like Allstate, Berkshire Hathaway (GEICO) and Progressive are telling Wall Street analysts that their combined ratios are too good compared to their competitors and they should lower their profit margins or run a loss to keep pace.
Obviously, as the old lies, damned lies, and statistics quote holds, anyone can find or manipulate numbers to justify just about anything, and so it’ll be up to the Rhode Island Legislature to decide whose case has the most merit. But at least now there’ll be a fair helping of stats on both sides.
Be heard: Rhode Island legislator contact information can be found here and here.
More information:
“Creating a Higher Cost Environment for Rhode Island Consumers”
Property Casualty Insurers Association of America, April 23, 2018
National Association of Insurance Commissioners 2014-15 Auto Insurance Database Report
NAIC, December 2017
NAIC 2016 insurer profitability report by state
NAIC, October 2017
Images:
Rhode Island and its Northeastern neighbors are shown. (omersukrugoksu/iStock)
The Northeast U.S. is shown. (natasa radic/iStock/Thinkstock)
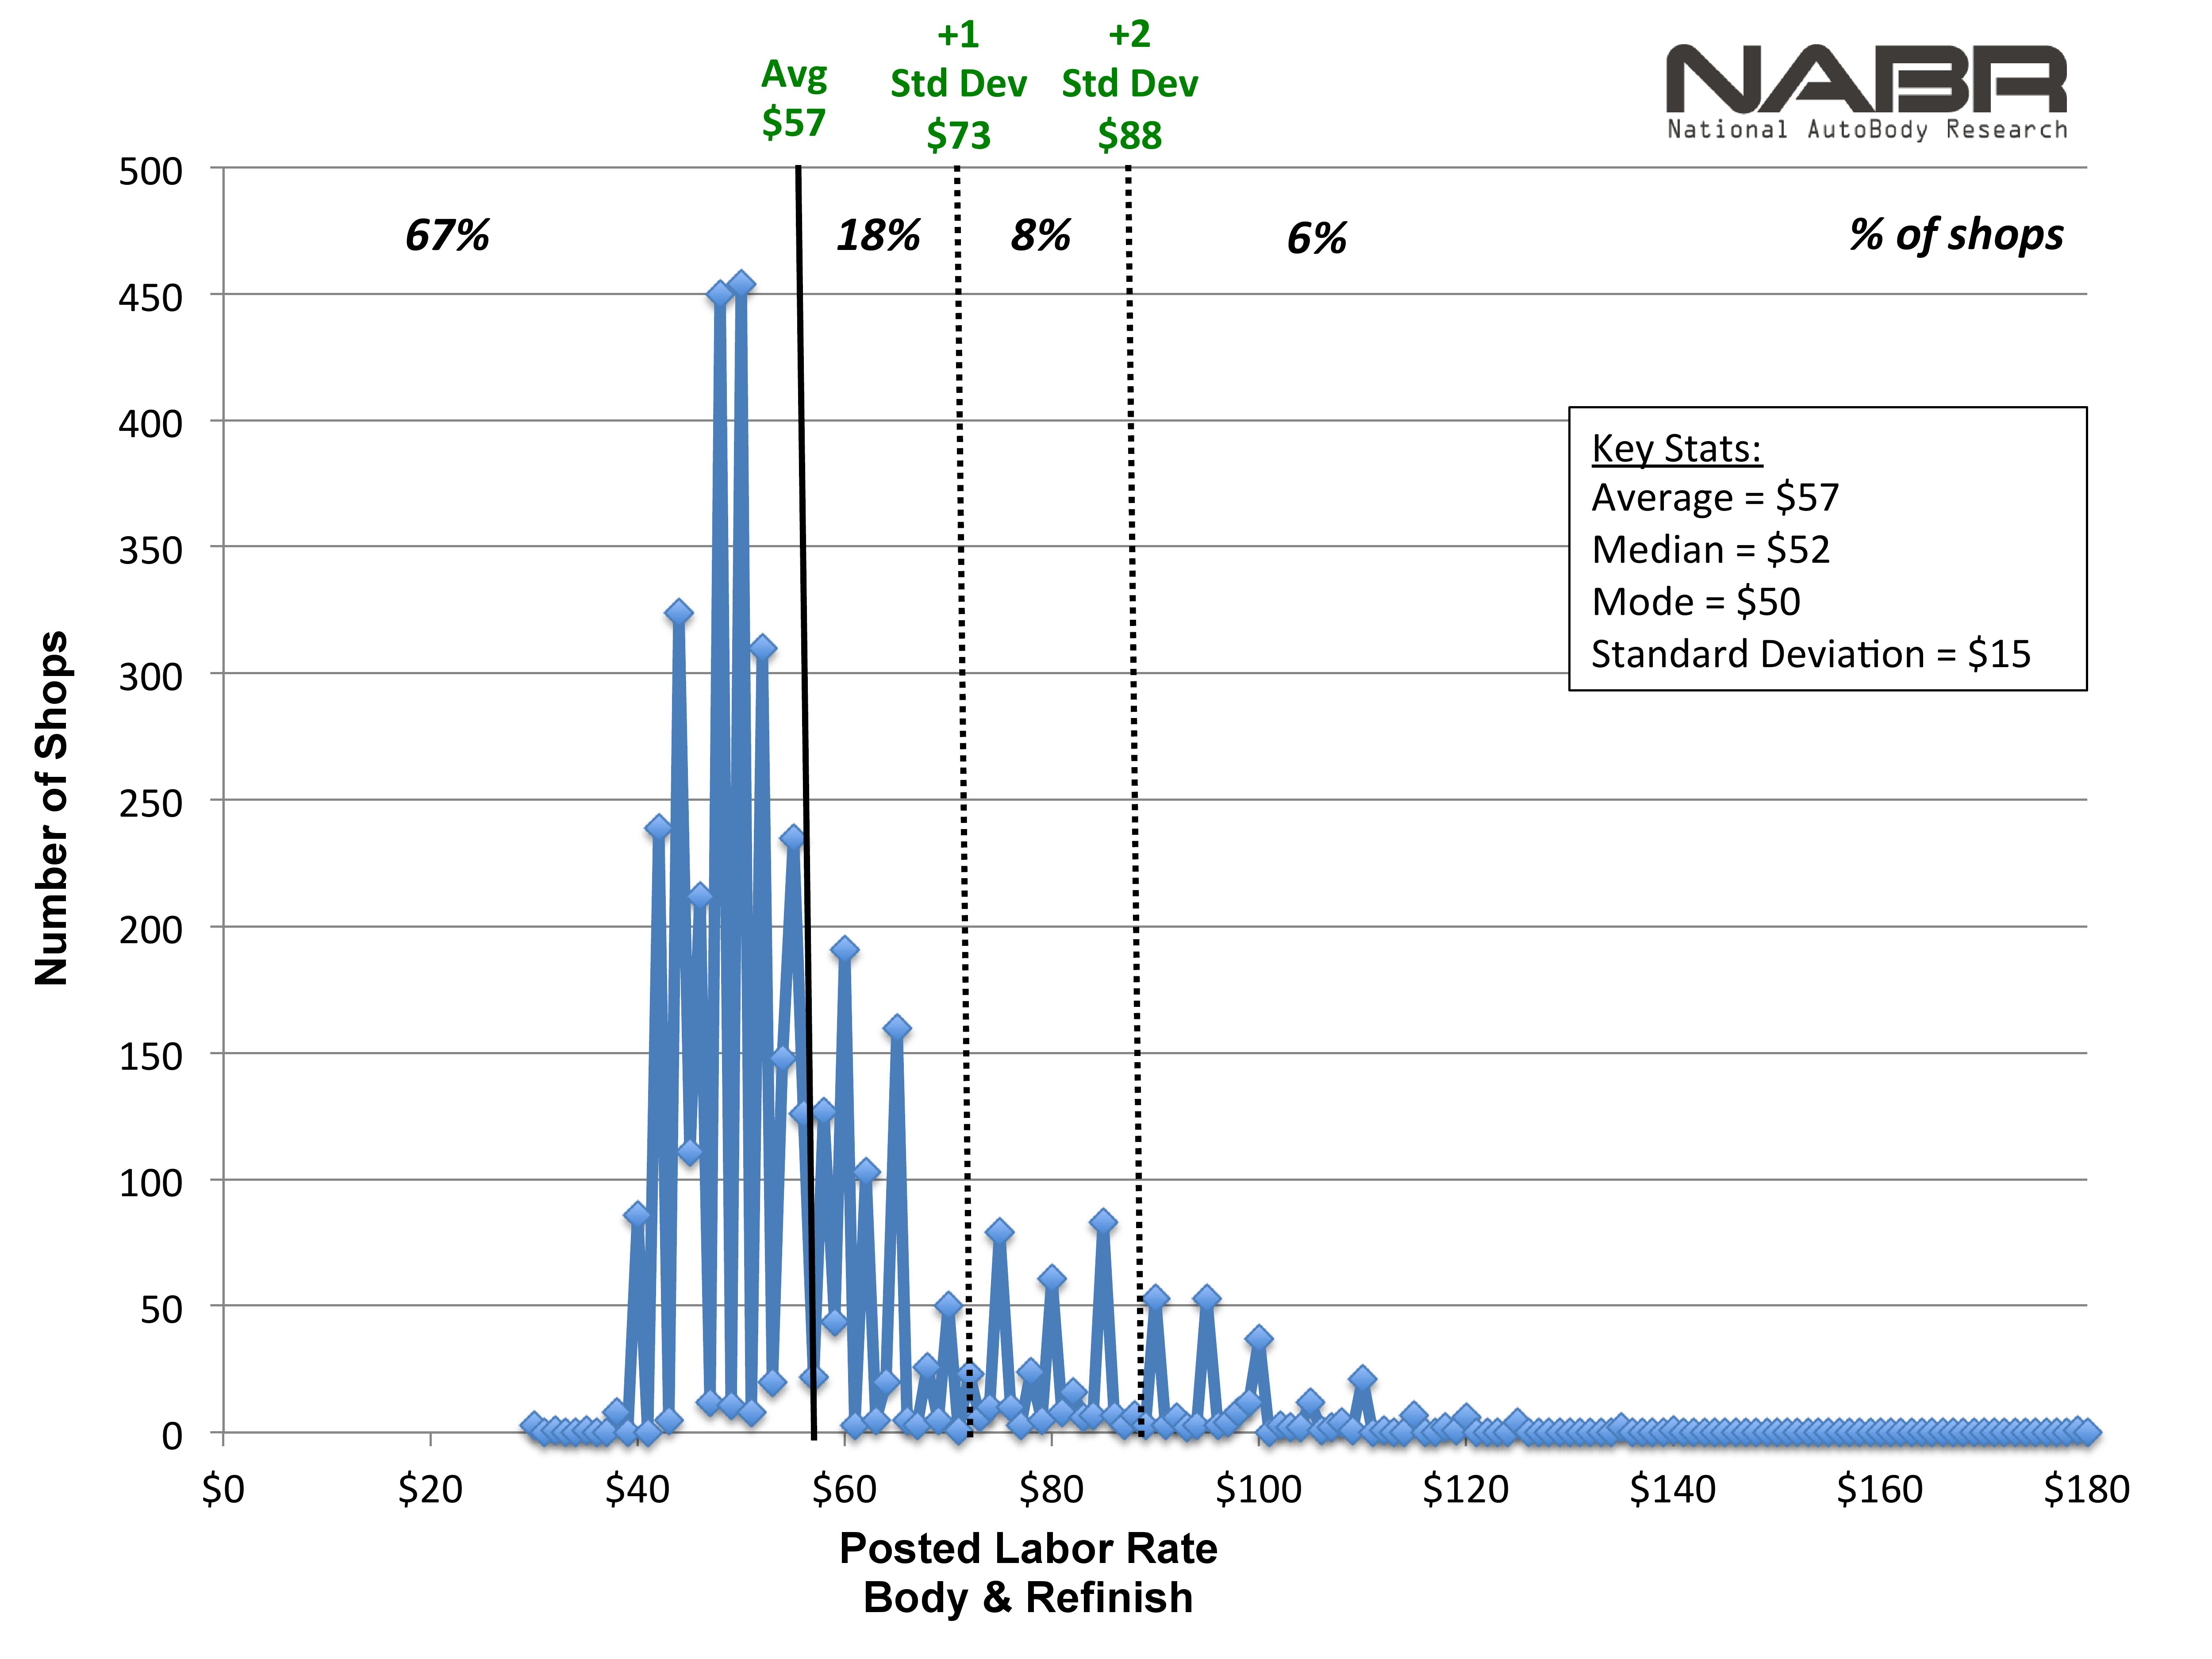
National AutoBody Research in March 2018 presented this chart of labor rate survey results from about 4,650 collision repairers nationwide. (Provided by National AutoBody Research)