Gerber parent: Margin takes a 4Q hit from DRP issue; parts help, hinder profit
By onBusiness Practices | Insurance | Market Trends | Technology
Boyd Group CEO Brock Bulbuck said earlier this month the company’s margins in part fell because of changes in DRP performance pricing and a revenue stream shifting to a greater proportion of parts compared to labor.
However, higher margins on parts did help offset this somewhat, he said.
“The lower DRP pricing this quarter is the result of certain DRP performance pricing arrangements changing in a way that is currently resulting in slightly greater variability quarter-to-quarter,” Bulbuck, whose company’s performance is heavily tied to its Gerber Collision chain, told analysts March 21. “Improved parts margins partially offset these negative impacts.”
The publicly-traded Canada-based company also owns Boyd Autobody, Assured Automotive and multiple glass interests. Its quarterly earnings reports and investor calls offer the industry a window into how national chains operate and a lesson in tactics to consider emulating — or countering with an alternative strategy.
The Boyd Group’s gross profit in the fourth quarter of 2018 fell to 44.3 percent of sales, down from 45.4 percent.
“In order to compete in the market place, the Company must consistently meet the operational performance metrics expected by its insurance company clients and its customers,” the 2018 Boyd annual report’s boilerplate description of risks to investor states. “Failing to deliver on metrics such as cycle time, quality of repair, customer satisfaction and cost of repair can, over time, result in reductions to pricing, repair volumes, or both. The Company has implemented processes as well as measuring and monitoring systems to assist it in delivering on these key metrics.”
Bulbuck didn’t elaborate on which insurer or insurers were responsible for the margin hit.
The company’s 2018 annual report said five non-government-owned insurers account for 40 percent of sales — down from 44 percent in 2017. About 13 percent of those sales (down from 14 percent) are from a single insurer; another carrier brings in 11 percent of sales, down from 13 percent.
It was unclear if the fourth-quarter issue was tied to performance under a traditional direct repair program model or a DRP performance-based agreement system. However, it sounds more like the latter.
Boyd’s 2012 annual report describes DRP metrics as having an potential influence on carrier pricing, but its “Operational Performance” risk language seen above only mentions volume as an insurer punishment for blowing KPI targets. In addition, there are no references to performance-based agreements. In 2013, the company discussed performance-based agreements and represents both pricing and volume penalties in “Operational Performance” risks.
Bulbuck said the important message for investors on the DRP issue was “we see this as variability.”
It wasn’t a “structural change” in margins and was the first time the company encountered the issue, he said.
“We’re still gaining experience with it,” Bulbuck said. He said he would expect volatility would diminish over time.
As far as magnitude, it could be seen in the quarterly results, he said.
Boyd said he didn’t think it would represent a structural change in margins, however, “just increased variability.”
Parts
Asked about the improved parts margin in the fourth quarter, Chief Operating Officer Tim O’Day said it involved collision parts and derived from focusing on a relationship with specific vendors. Some had to do with improved negotiation, but it mostly involved a focus on key suppliers, he said.
The other parts issue described here is one to watch by the entire industry. Repair bills proportionally shifting to parts from higher-margin labor might be a reality of vehicle technology requiring replacement over repair.
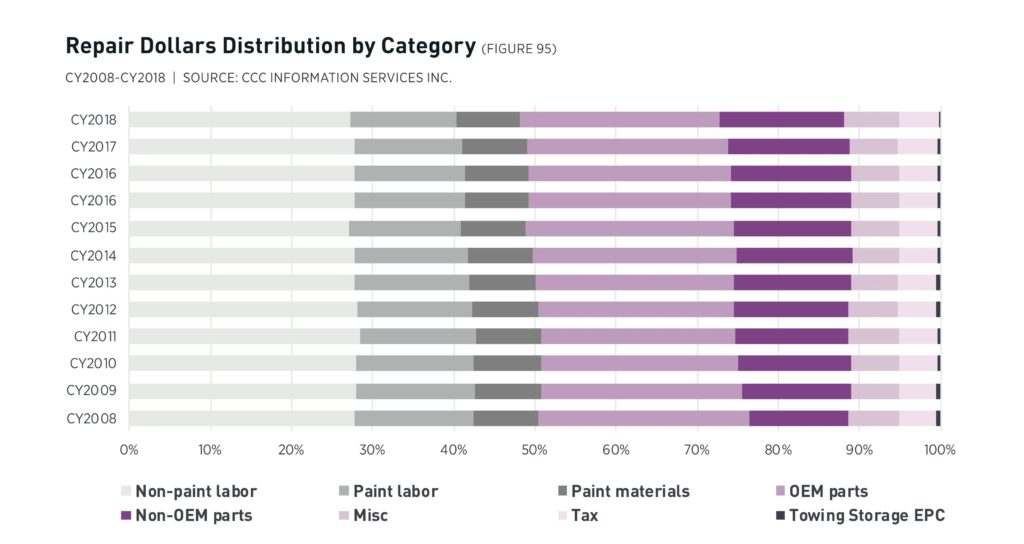
“Vehicle complexity has grown with more electronics, safety features and complexity of materials, as the growth in average number of part replacements per claim and parts share of the overall repair cost have grown,” CCC wrote in its recently released 2019 “Crash Course.” “Individual cost-per-replacement part has grown on average at least 1 percent annually over the last several years, while OEM share of replacement part cost has continued to decline.”
In 2001, parts were just 40.7 percent of the total repair cost in collision work. That proportion was the same in 2009, according to CCC, but the average number of parts replaced per estimate rose 0.4 points to 9.7 By 2018, parts represented 42.5 percent of labor bills, with an average of 11.9 parts replaced per claim.
Ironically, the proportion of parts cost per claim on liability claims is down, moving from 36.6 percent of the bill to 36.3 percent over that time. The number of replaced parts rose from 5.6 parts to 6.8. Some of this might have to do with the nature of collision versus liability crashes, but since CCC compared vehicle ages apples-to-apples, it also looks like third-party customers might be getting a raw deal from either their body shops or the at-fault parties’ carriers. On the whole, CCC reports parts are now 39.9 percent of the repair bill, up from 38.2 percent in 2009.
But when you look at collision-claim vehicles aged 0-6 years — more than two-thirds of that data set — repair bills start shifting to parts more dramatically. Current-year vehicles in 2001 had repair bills in which parts made up 42.3 percent of the tab and saw 10.9 parts replaced on average. By 2018, the mix had shifted to 46.9 percent of the repair cost and 15.2 parts replaced.
While some OEM repair procedures will adapt after engineers validate new repairs for certain parts, other replace-only parts are going to stay that way perpetually. For example, barring new research, we’d doubt certain uberpascal steel safety cage components on vehicles today will be able to be sectioned or straightened in 2026 just because the car happens to be 7-plus years old.
More information:
Boyd Group (Gerber Collision) 2018 annual report
Boyd Group, March 21, 2019
Boyd Group 2018 results earnings call
Boyd Group, March 21, 2019
Images:
A transparent vehicle can be seen Sept. 11, 2013, in the TRW booth at a German auto show. (Tramino/iStock)
CCC 2019 “Crash Course” data reveals parts are making up a larger proportion of repair bills than a decade ago. (Provided by CCC)