Enterprise: LOR rises 4.9 days for Q1 2022, continuing string of ‘unprecedented’ increases
By onAnnouncements
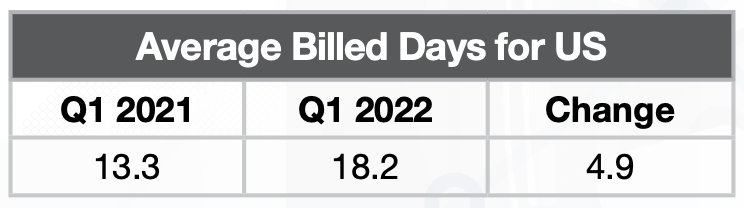
Average Length of Rental (LOR) for collision-replacement rentals in the first quarter of 2021 increased by 4.9 days from 2021, continuing a “trend of unprecedented industry increases,” Enterprise Holdings said in a quarterly report issued Thursday.
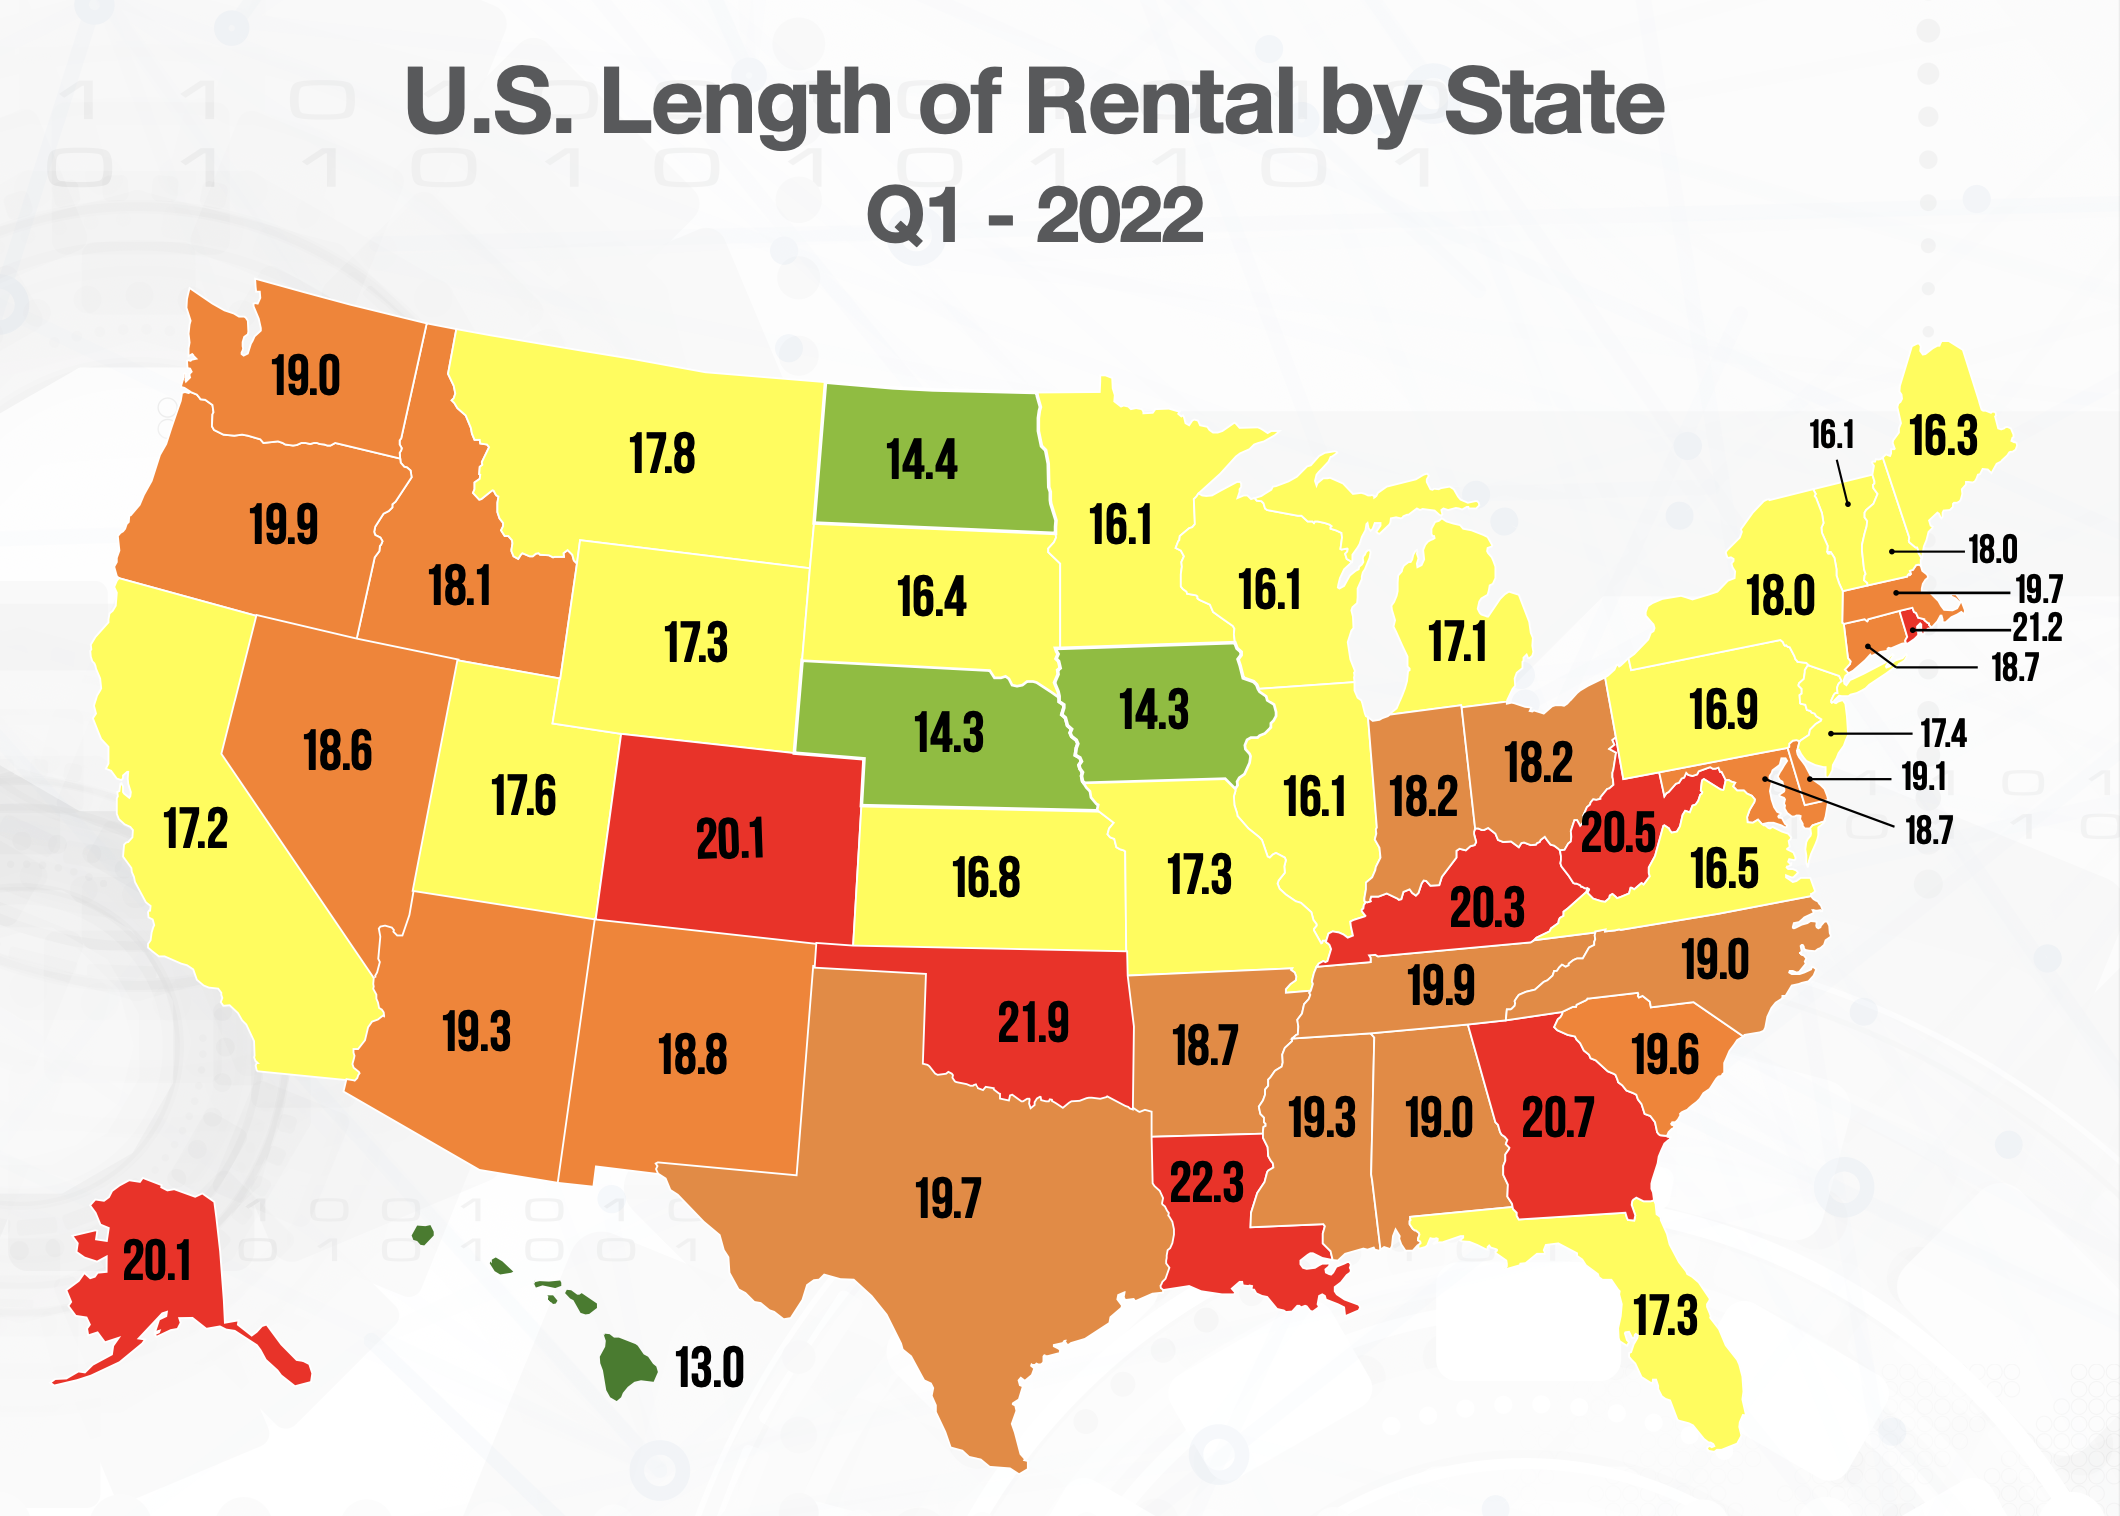
Nationwide, average LOR was 18.2 days, up from 13.3 days in the first quarter of 2021. Enterprise said the increase was largest for non-drivable rentals, at 7.8 days, and that LOR was up by 4.1 days for both drivable and total loss claims. LOR is a widely used industry metric for repair cycle times.
The report found the increase was driven by “national issues with deep causal factors, including part delivery delays, shop production capacity and the impact of new technologies such as electric vehicles (EVs).”
 The results reflect “many factors affecting everyone in the collision industry, including technician staffing, ever-changing parts availabilities, new and used vehicle pricing, inflationary pressures and new claims processes,” Enterprise concluded. “The entire industry will play a part in ensuring all collision-related businesses are aligned, not just to offer procedural solutions, but to ensure our mutual customers receive safe and proper repairs, an excellent experience and peace of mind.”
According to the report, January is one of two peak times for LOR, with numbers tending to fall in February and March. While that was true this year, it said, the numbers were “much higher.”
However, Enterprise stopped short of saying whether the numbers might be predictive. “Traditionally, the second quarter of each calendar year yields the lowest LOR, but it remains to be seen how these industrywide issues will affect this year’s results,” the report said.
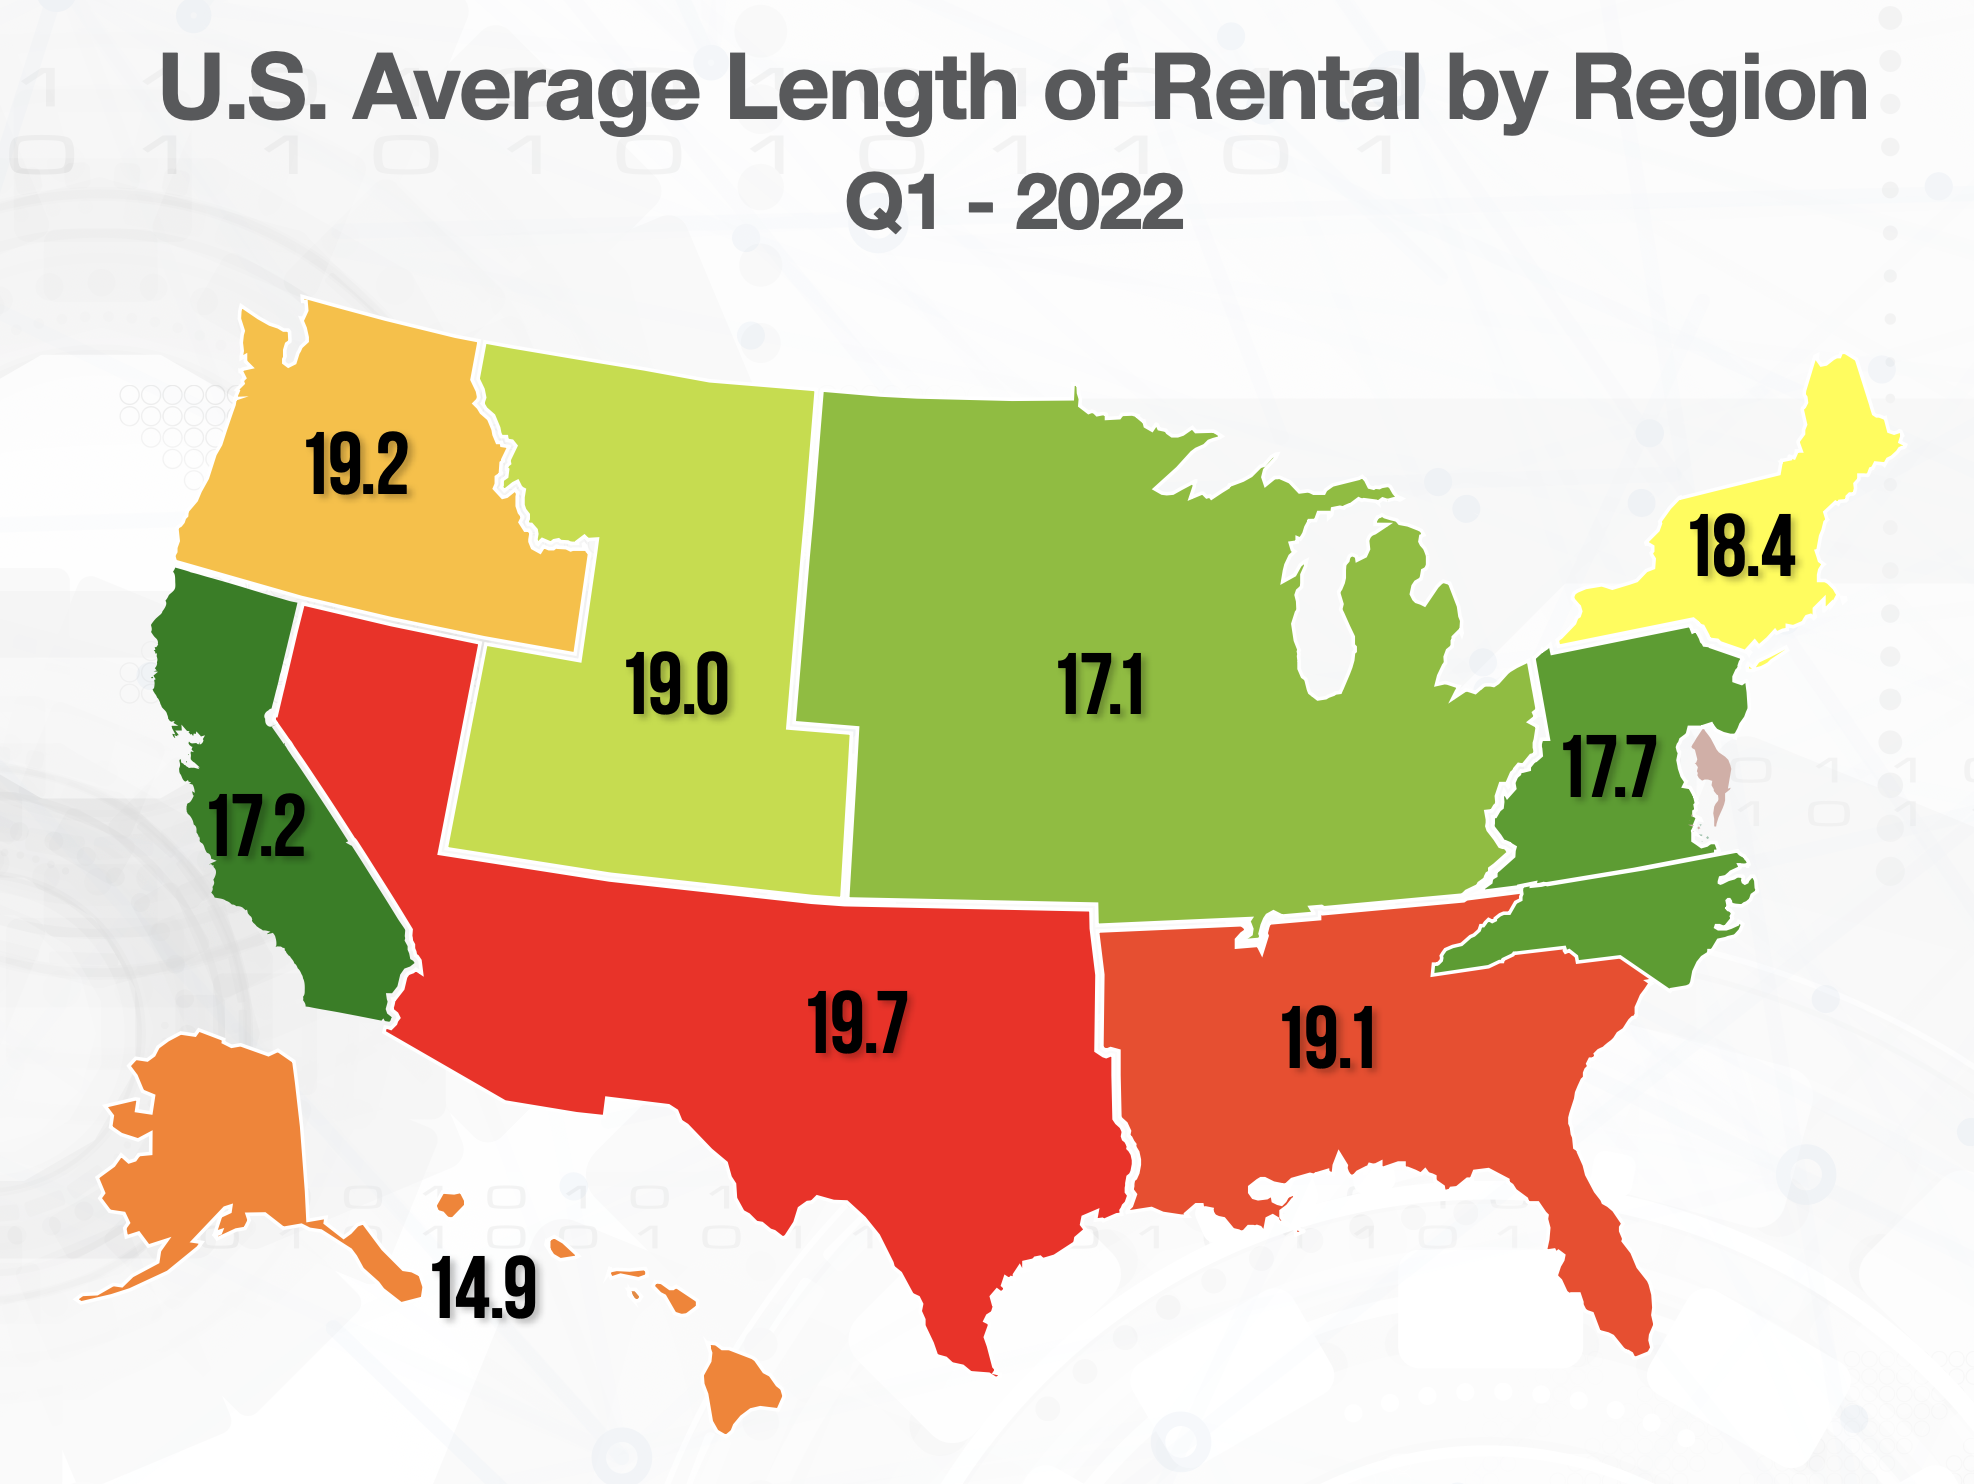
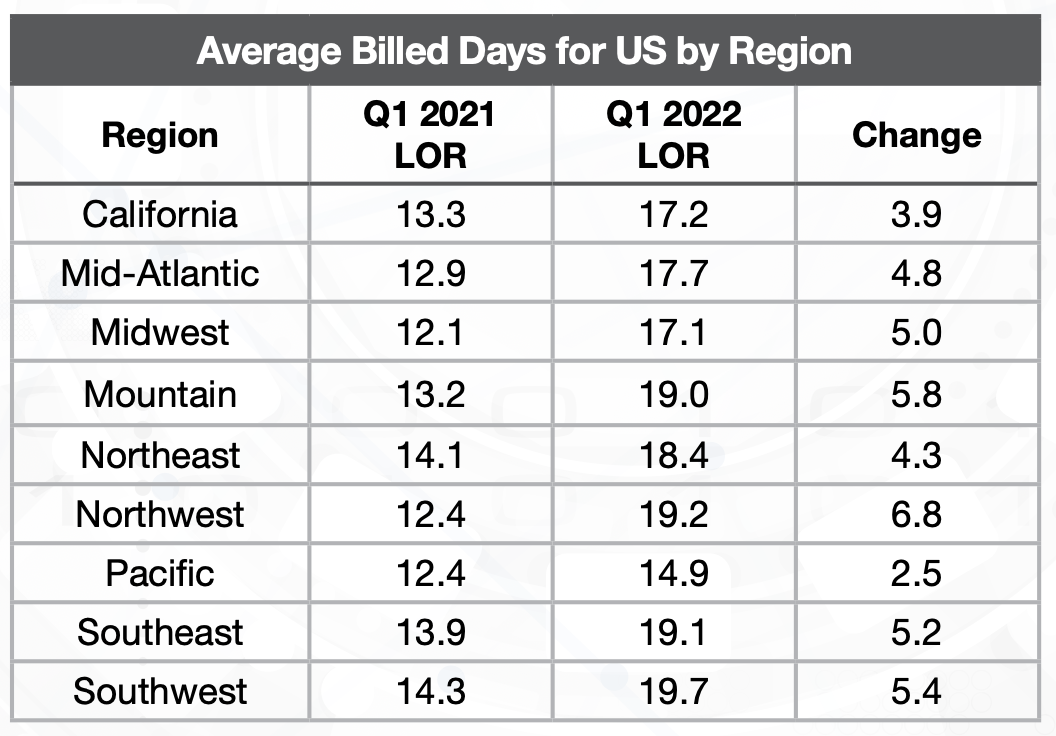
No region was immune, Enterprise said. Average LOR was up across the board, with the Southwest, Northwest, Southeast and Mountain states experiencing the longest LORs, each of 19 days or more.
 The state of Washington, which had been among the bottom states overall in 2021, recorded the largest overall LOR increase, of 7.2 days. Nine other states experienced increases of more than six days, while another 28 states and the District of Columbia recorded increases of more than five days, Enterprise said. The lowest increase, 1.5 days, was recorded in Hawaii, while the highest, 22.3 days, was experienced in Louisiana.
The report noted that in Q1 2021, the highest LOR in any state was Louisiana, at 16.4 days. “One year later, only nine states and the District of Columbia have a lower LOR than Q1 2021’s highest mark,” it said.
Shop backlogs, parts delays
“The length of rental for the first quarter doesn’t come as much of a surprise based on what we were seeing in terms of the backlog of work at U.S. body shops at the start of the year,” John Yoswick, editor of the weekly CRASH Network newsletter, said in the report.
According to CRASH’s figures, 10 of the nation’s 11 regions reported the longest average backlogs since CRASH Network began reporting the statistic in 2017.
Yoswick said CRASH’s survey of nearly 500 shops in January found that only one in 100 would be able to start repair work on a damaged car immediately. “The percentage of shops that might be able to fit you in within a week? Only 3%,” Yoswick said. “An astonishing 15% of shops are reporting a backlog of more than eight weeks.”
“The average scheduling backlog jumped to more than a month in January, reaching an average of 4.5 weeks nationally. That is more than a week longer than the record-high Q4 2021 backlog,” he said.
According to Yoswick’s research, the Q1 2022 backlog was almost 2.5 times the length of the typical first-quarter backlog. Since 2017, the report said, his research shows the average backlog for the first quarter has been just under two weeks.
A record 84% of shops in January said they were scheduling new work two weeks or more into the future, and 52% said they were scheduling new work more than four weeks out.
At the same time, PartsTrader recorded “a record high of the median delivery days for all part types,” Greg Horn, the company’s chief innovation officer, said in the report.
“We measure the median plus two standard deviations to capture the complete picture of all parts needing to be replaced,” Horn said. “What we saw in the first quarter of this year is a median score of 15.6 days for the outliers. This is double of the median delivery days (plus two standard deviations) for the outliers that we saw in Q1 2021. As Enterprise has found, no region was immune from these delays; we saw significant increases in all regions in the U.S., with the highest increases in the upper Midwest and East Coast.”
Impact of BEVs
The steady growth of battery electric vehicles (BEVs), which are more difficult to repair because of equipment and safety considerations, has played a small but measurable role, Enterprise said.
Ryan Mandell, director of claims performance for Mitchell International, said in the report that BEVs represented 1.66% of all repairable claims in Q1, up from 0.42%, 0.74%, and 1.01% in the first quarters of the previous three years.
“On average, BEVs are 27.83% more costly to repair than internal combustion engine (ICE) vehicles and require an average of 5.76 more labor hours per repair, resulting in longer keys-to-keys cycle times,” Mandell said.
Drivable claims
Nationally, drivable LOR for replacement rentals stood at 15.5 days for Q1, up 4.1 days from the first quarter of 2022. Nine states experienced increases of more than five days. Oklahoma and Louisiana had the highest overall drivable LOR at 18.9 days, while Hawaii, at 10.9 days, and North Dakota, at 11.0 days, had the lowest.
Non-drivable claims
The largest increases in LOR were for non-drivable replacement rentals. The first quarter of 2022 was 7.8 days higher than the previous year, at 26.7 days, compared to 18.9 days in Q1 2021. Eight states had increases greater than 10 days, and an additional seven states had increases greater than nine days. The smallest increase was in Massachusetts, at 4.1 days, followed by New York at 5.1 days, Mississippi at 5.4 days, and Hawaii at 5.6 days.
Five states – Louisiana, Oklahoma, West Virginia, South Carolina, and Oregon – had an average non-drivable LOR greater than 30 days, a first. Nine other states were at 29 days or higher, followed by eight other states at 28 days or more. Lowest was the District of Columbia at 23.1 days, which the report noted was still 8.7 days greater than Q1 2021.
“Non-drivable frequency in Q1 2022 remained elevated above 20% for the second consecutive quarter (20.22%). The previous years’ first quarter non-drive rates were 18.25%, 19.68%, and 18.62% respectively from 2019-2021,” Mandell said.
Total loss claims
The average LOR associated with total losses was 18.4 days in Q1 2022, up 4.1 days from Q1 2021’s 14.3 days. “While some of this rise may be attributed to the increased severities of collisions, it also could be impacted by higher Total Loss thresholds and carrier calculations, pushing more vehicles into the repairable category,” Enterprise said.
Mandell said in the report that the trend is likely to continue. “As Actual Cash Values (ACV) rise, we can expect Total Loss frequency to decline as more borderline losses are deemed to be more economical to repair. This has been the case in the U.S., which saw a 16.1% Total Loss frequency in Q1 2022, compared to 17.2% in Q1 of 2021. Such a scenario could impact shop capacity, especially in the face of a tight labor market, and drive keys-to-keys cycle times even higher.”
The biggest quarter-over-quarter increase was seen in the state of Washington, at 9.4 days, followed by Oregon, with a 9.1-day increase. These two states accounted for the highest overall Total Loss LOR, Enterprise said. Two other states (Idaho and Rhode Island) and the District of Columbia increased eight days or more.
The lowest total loss LOR increase, 1.2 days, was seen in Hawaii. Only two other states, Texas and Alabama, saw an increase of 2.9 days or less. The lowest total loss LOR was in Florida (15.1 days), an increase of 3.1 days.
The quarterly LOR summary is produced by Enterprise Rent-A-Car, through its ARMS Automotive Suite of Products. More information is available at armsautosuite.com.
More information:
Enterprise Holdings Q1 2022 U.S. Length of Rental Report
Images
Featured image: The Enterprise Rent-A-Car location in Fort Collins, Colorado. (RiverNorthPhotography/iStock)
Maps and charts provided by Enterprise.