
EV claims volume up 40% as repair cost divide with ICE vehicles continues to expand
By onMarket Trends
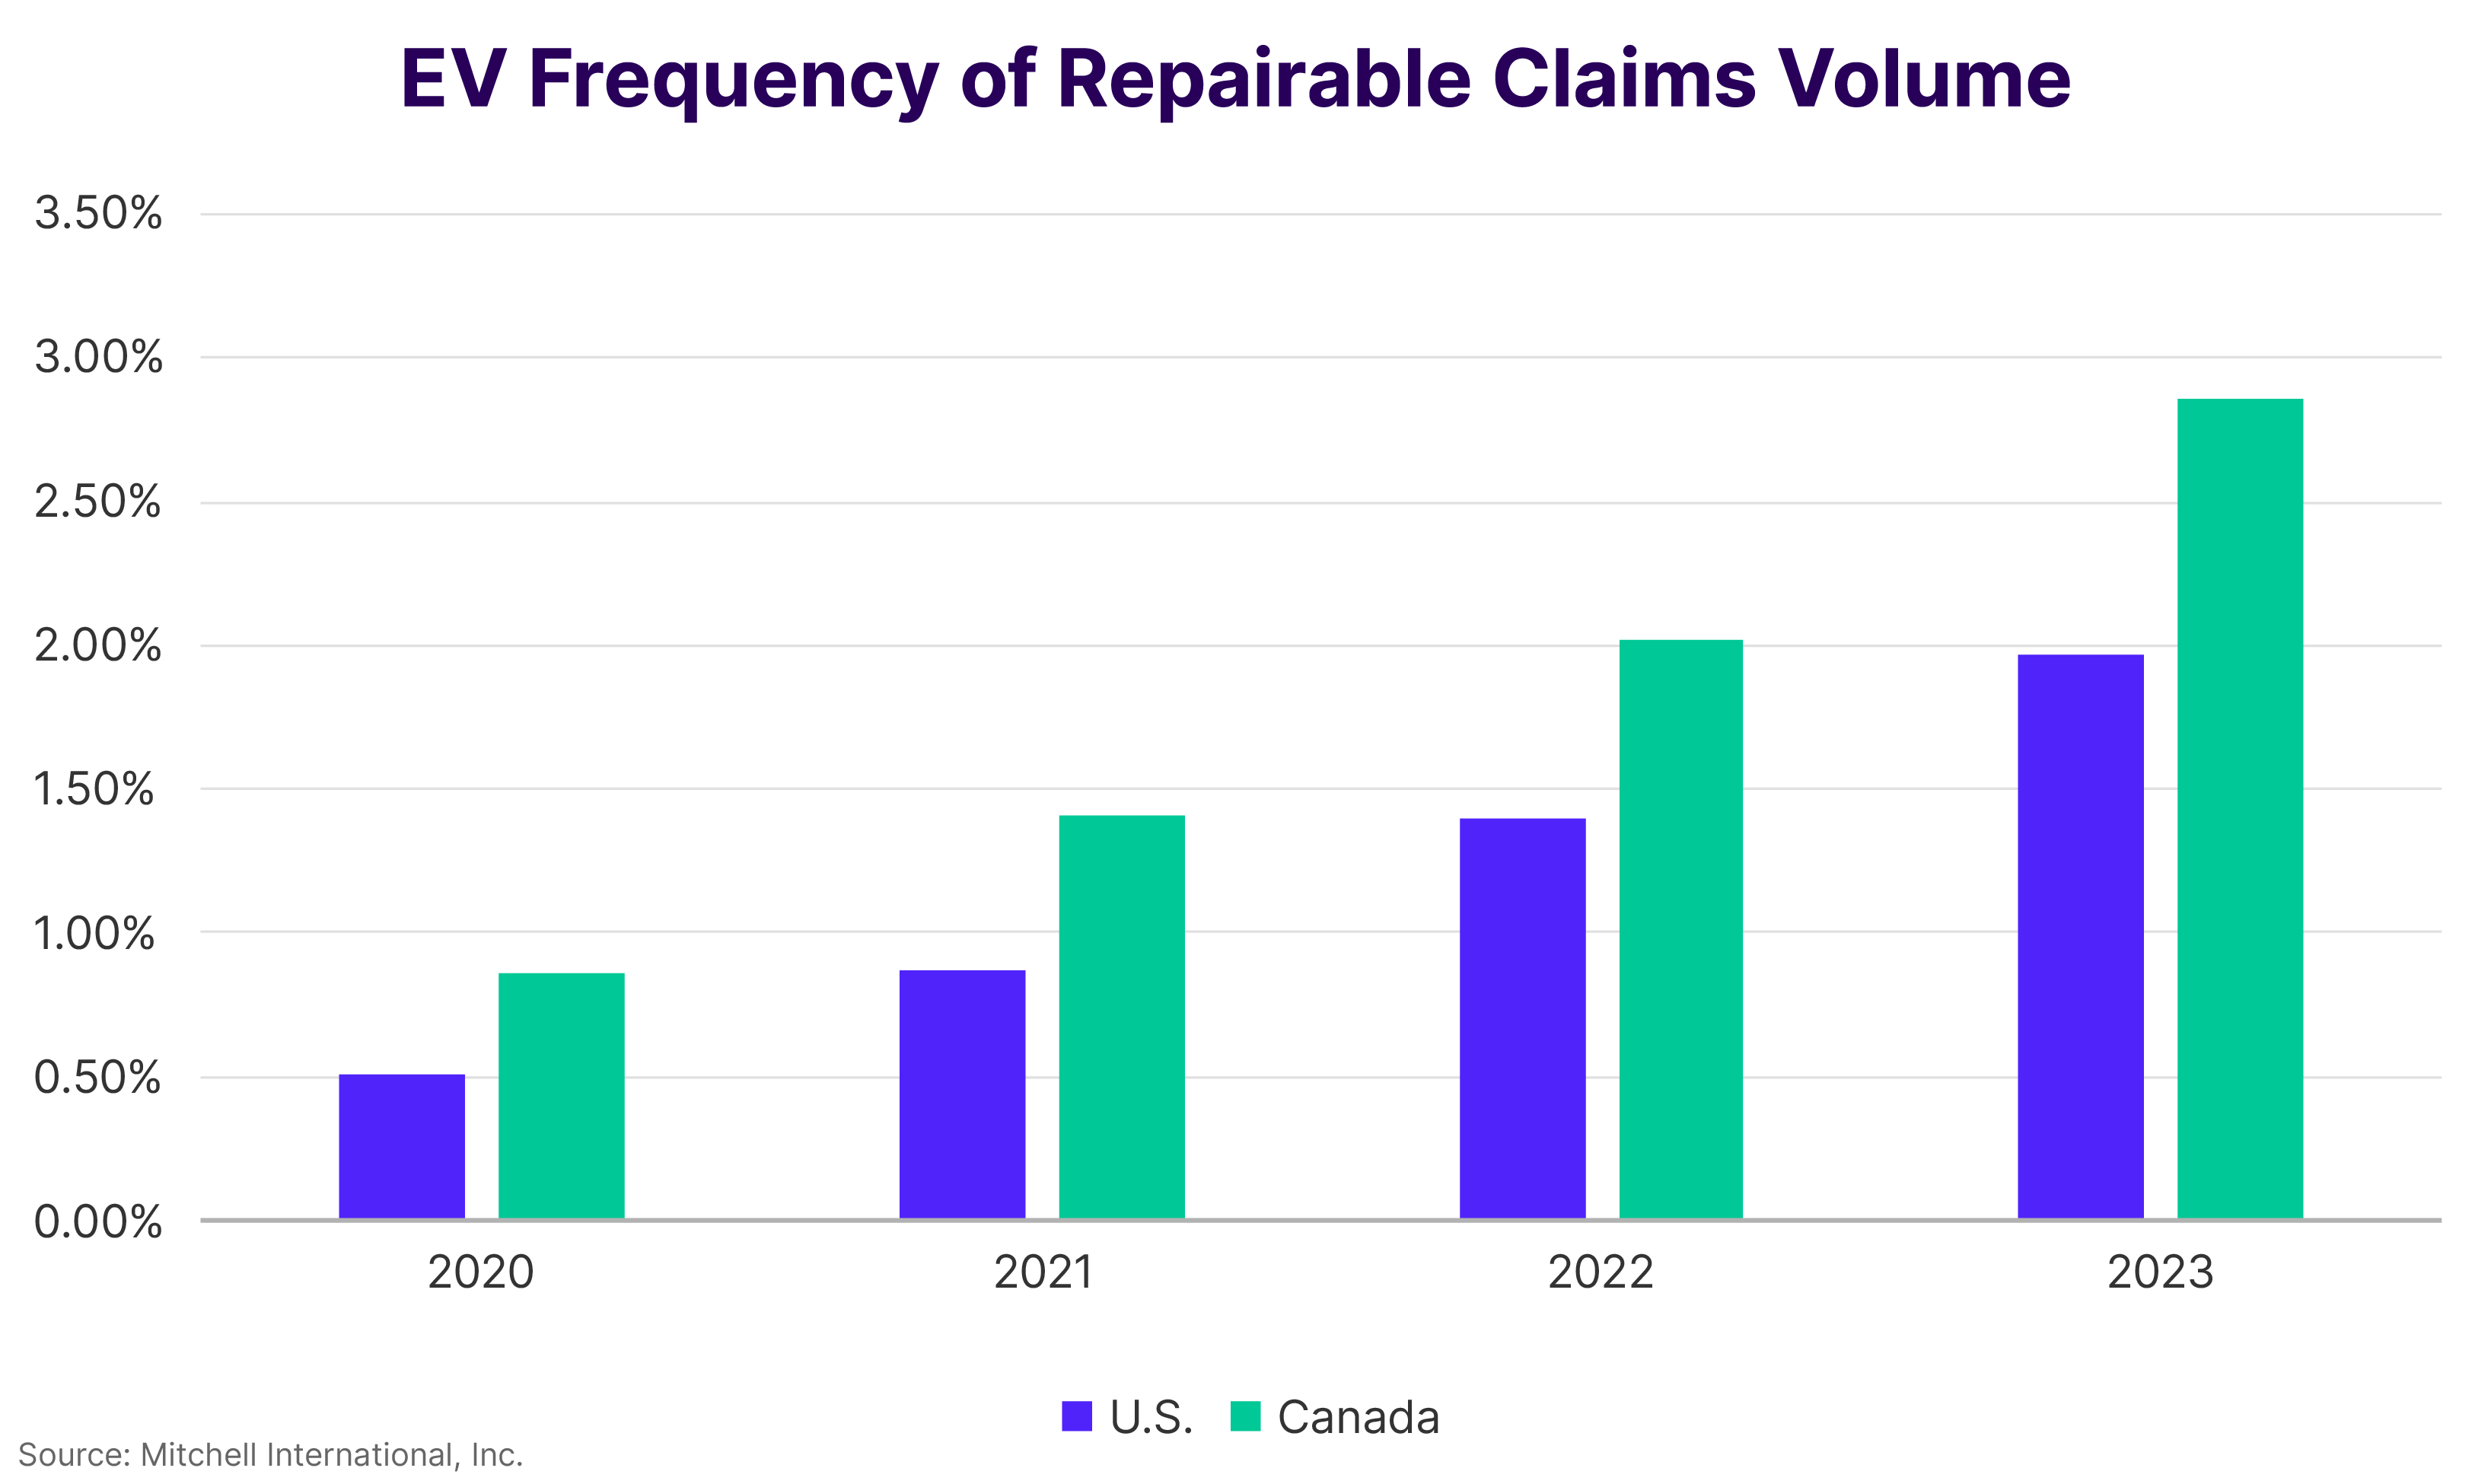
Mitchell International’s latest Plugged-In: EV Collision Insights report found that electric vehicle claims volume increased in 2023 by more than 40% in the U.S. and Canada.
Mitchell Claims Performance Director Ryan Mandell called it a record year.
“Not only did the frequency of EV collision claims rise to historic levels, but the U.S. also surpassed 1.2 million in new EV sales for the first time ever,” he said. “As long as consumer adoption remains strong, EVs will continue to have a significant impact on the auto insurance industry — creating challenges for everything from underwriting to the delivery of proper and safe repairs.”
Last year ended with EV repairable claims frequency at 1.97% in the U.S. and 2.86% in Canada.
That said, the New York Times reported in February that President Joe Biden is expected to slow his attempt to combat climate change by pushing new EV production. Last year, his administration proposed that 60% of automakers’ new vehicle production be EVs by 2030. Biden’s new timeline will reportedly have EV production increases begin after 2030.
While EV sales are increasing, public EV charging infrastructure is still lacking, with the installation of public chargers not keeping up with current and projected sales, according to a 2023 analysis by the Alliance for Automotive Innovation (Auto Innovators).
During the first three quarters of 2023, the number of public EV chargers increased by 26% year-over-year while EV sales increased by 59%, according to Auto Innovators.
When compared to 2020, the frequency of claims for repairable EVs more than tripled in 2023, according to Mitchell. Tesla’s share of U.S. new vehicle sales reached a record high of 4.2%. However, lower-priced EV alternatives like the Kia EV6, Hyundai Ioniq, and Volkswagen ID.4 saw tremendous growth in 2023 — 194%, 144%, and 139%, respectively compared to the previous 12 months, according to Mitchell.
The fact that EVs are heavier, on average, than their ICE counterparts may be one of the factors to blame for a higher frequency of EV air bag deployments (3.62%) last year compared to ICE alternatives (2.45%). Collision repairs that involve an air bag deployment are typically three times more expensive than those without one adding to the repair cost differential between EVs and ICE vehicles, Mandell said.
In addition to tracking 2023 claims volume, the Mitchell report compares EVs to internal combustion engine (ICE) vehicles by:
-
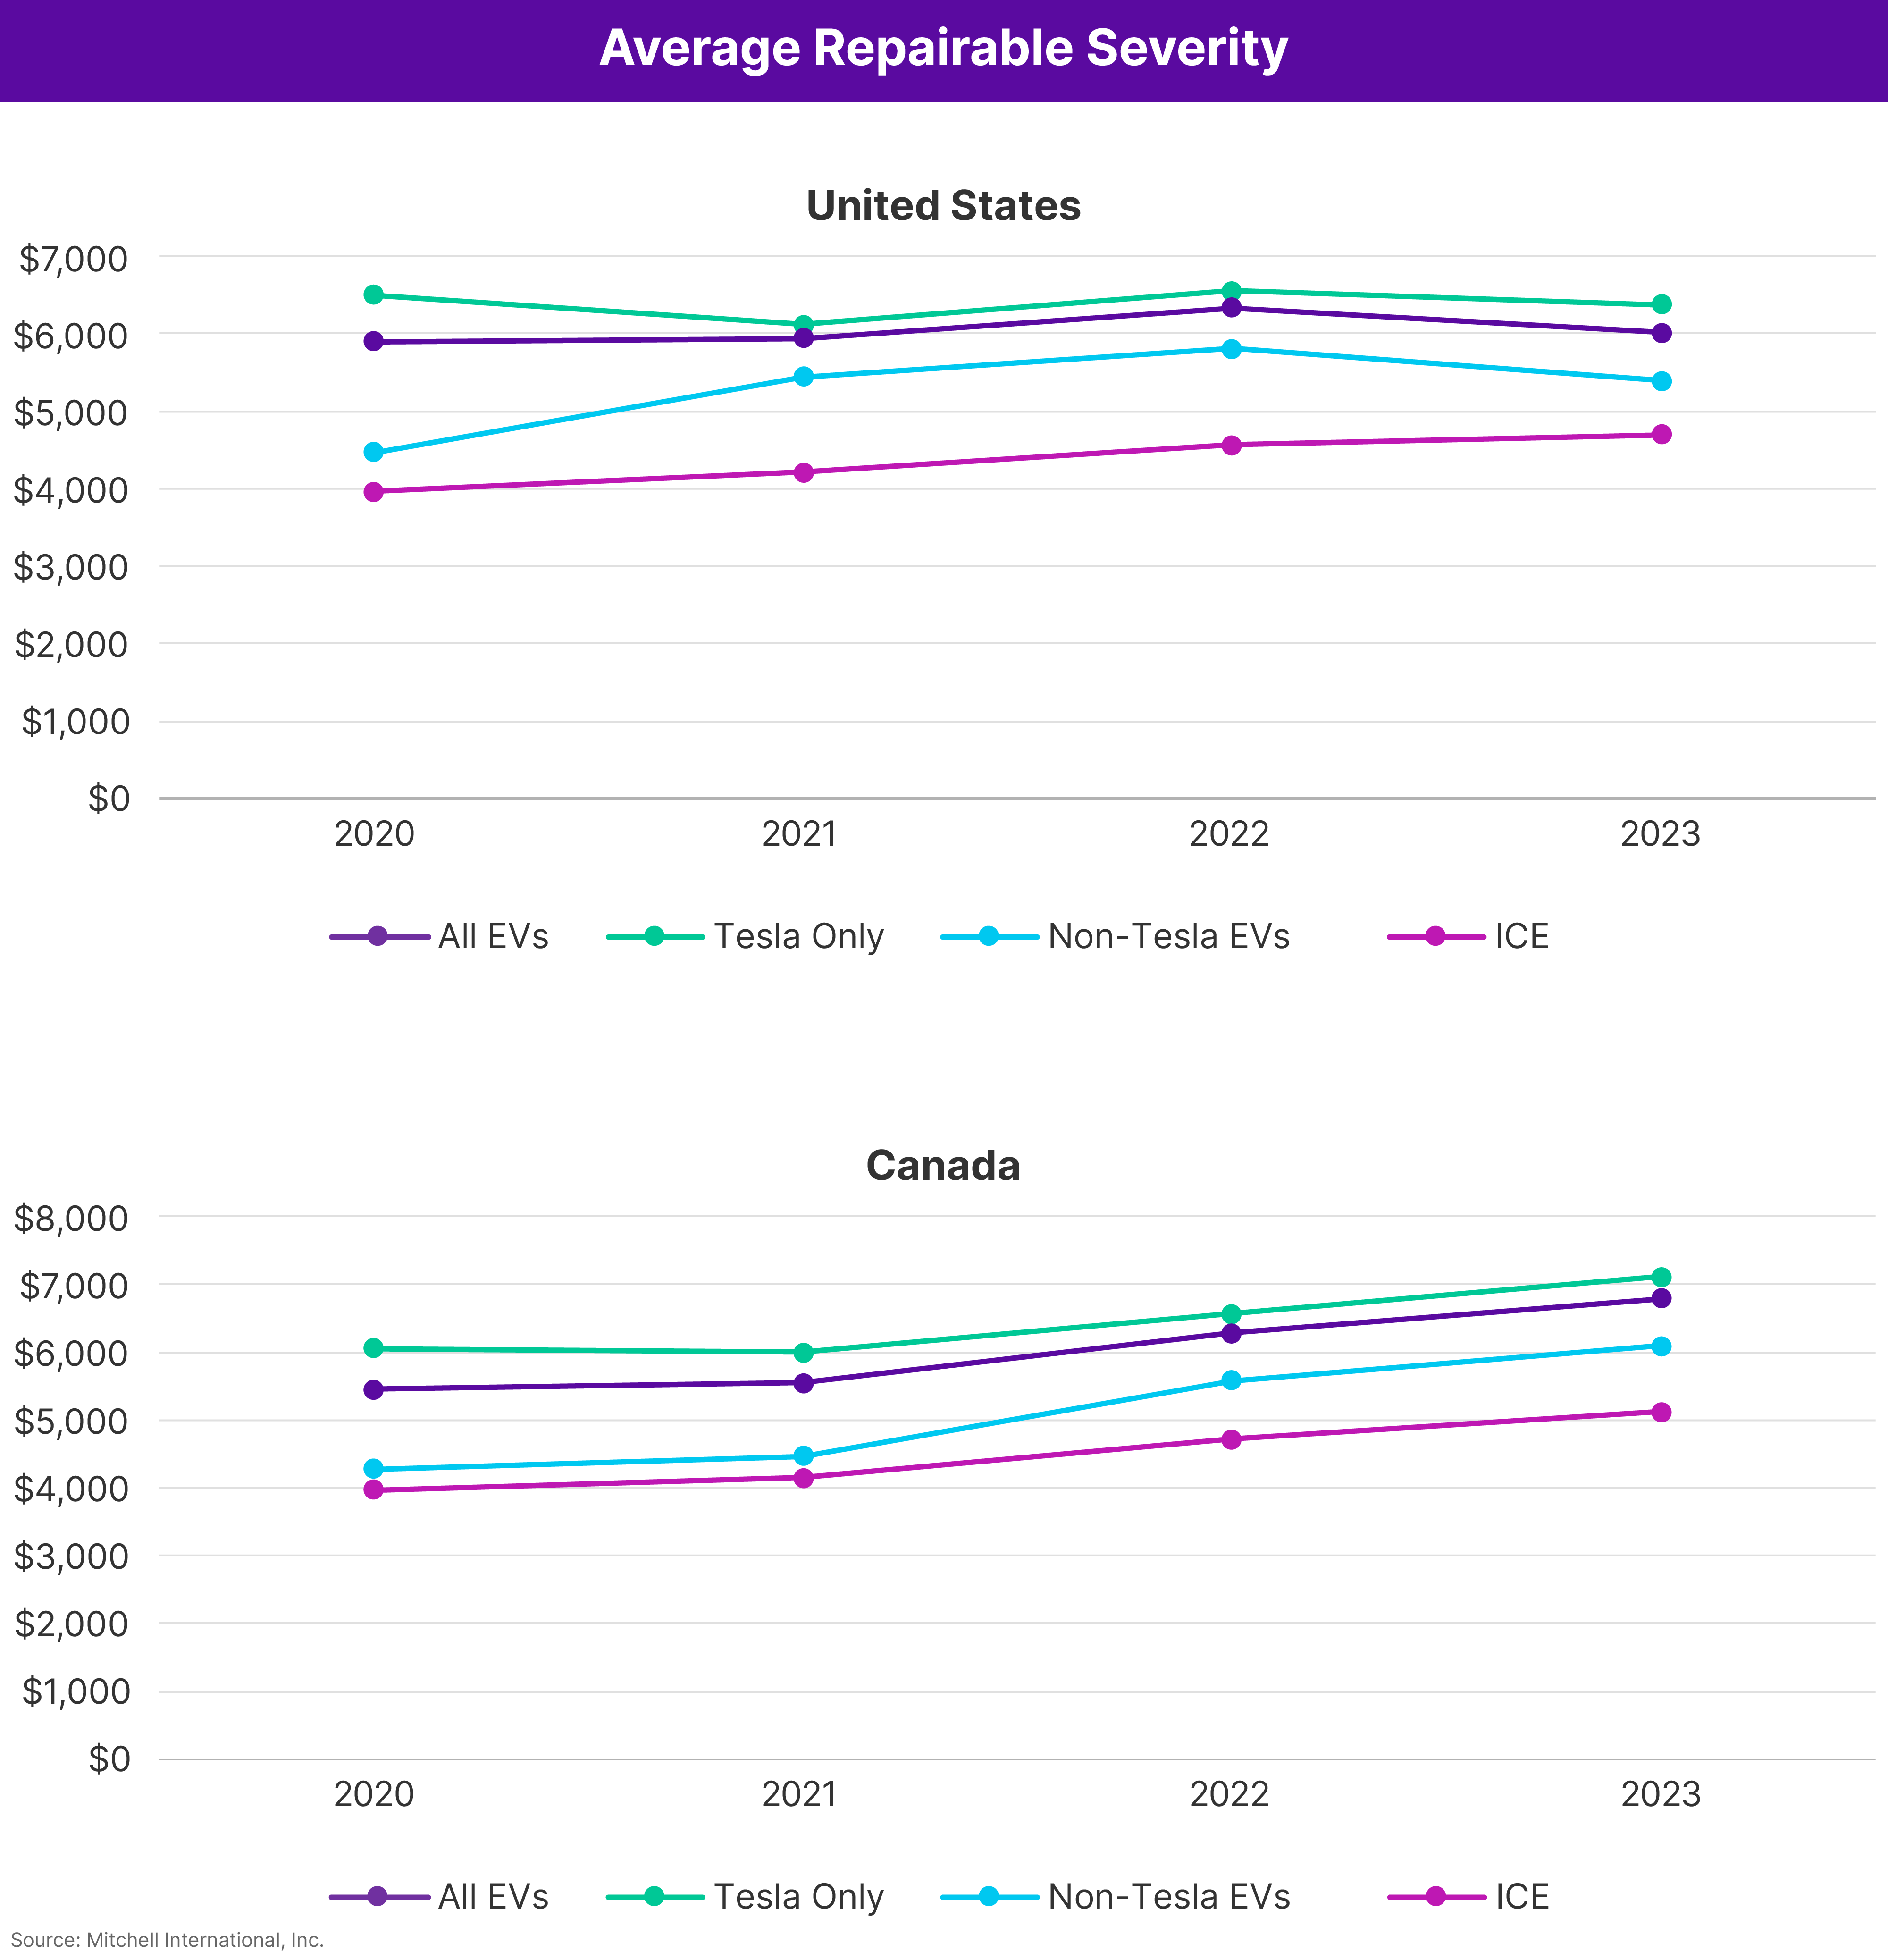
- Claims Severity: Last year, average severity in the U.S. for repairable EVs was $6,018 compared to $4,696 for ICE alternatives. This represents a year-over-year decrease of 5% for EVs and an increase of 3% for ICE vehicles. In Canada, severity was $6,795 for EVs versus $5,122 for ICE-powered options, jumping 8% from 2022 to 2023.
- Vehicle Complexity: For 2020 and newer collision-damaged automobiles, EV repairs were 50% more likely to include an operation associated with the sensors used in advanced driver assistance systems (ADAS) based on 2023 data than ICE vehicles, which also rely on ADAS.
- Parts Repairability: EVs are more likely to use parts made of lightweight materials, which can impact repairability. In 2023, on average only 12% of EV parts were repaired versus replaced. For ICE-powered options, the percentage of parts repaired was closer to 15%.
- Material Construction: EVs tend to be heavier than ICE automobiles due to the battery weight. That may be one reason they had a higher frequency of air bag deployments (3.62%) than ICE options (2.45%) last year, adding to repair costs.
Mitchell cites Kelley Blue Book’s estimate which predicts sales of new EVs this year will increase along with demand. Kelley Blue Book reported that nearly 1.2 million EVs were sold in the U.S. in 2023, representing 8.1% of gross new vehicle sales volume with an anticipated U.S. market share of 10% this year.
Images
Featured image: Stock photo of an EV crash test. (Credit: EvgeniyShkolenko/iStock)
Charts provided by Mitchell International for publication