Calibrations more than 4 times likely on 2023 MY vehicles
By onCollision Repair | Market Trends
With more ADAS comes more scans and calibrations — more than four times the calibrations for 2023 model year (MY) vehicles versus 2014, according to CCC Intelligent Solutions.
CCC’s latest Crash Course Report found that last year, 59.7% of car repair appraisals of 2014 MY vehicles included a scan operation, and only 6% included a calibration operation. For 2023 models, 70.7% of appraisals included a scan and 27.6% included a calibration, according to the report.
Replaced camera, sensor, lidar, and radar components per appraisal was nearly three times more for 2023 MY vehicles compared to 2014 MY vehicles.
“Much of what the industry is experiencing is reflective of a new normal where complexity, beginning with the vehicle itself, is reshaping the market landscape,” said Kyle Krumlauf, CCC industry analytics director and co-author of Crash Course, in a news release. “CCC has shifted to a quarterly publication of Crash Course to support the growing needs of our customers and the industry. This change allows us to provide more data and insights more frequently, helping industry participants anticipate challenges, and be better equipped for the road ahead.”
The last report came out in March 2023.
Features like ADAS became more mainstream beginning in 2016. MY 2016 and newer vehicles now account for nearly 40% of all light-duty vehicles in operation in the U.S., according to the report.
Many cars include automated driving functions as well as Level 1-2 automation and safety features like automatic emergency braking (AEB). AEB-equipped vehicles made up 95% of vehicles in 2023.
“While ADAS can prevent some accidents — particularly those at lower speeds — an ADAS-equipped vehicle exposes more electronic components and parts to damage at higher repair costs,” the report says.
According to CCC’s research, while vehicles may be safer, more capable of avoiding crashes, and more environmentally friendly, advanced technology contributes to costlier repairs, higher claims costs, and longer cycle times.
Backlogs have contributed to a 60% increase in the time it takes for vehicles to enter repair shops after estimates are completed, compared to before the COVID-19 pandemic, CCC said.
CCC concluded in the Q1 report that:
-
- “Repairs now require more parts, labor hours, and diagnostic operations like scanning and calibration;
- “Vehicle parts cost more now thanks to new material types;
- “Parts now account for a higher share of overall repair costs;
- “Shops are seeing more replace versus repair, demanding different skill sets from repair technicians at higher costs;
- “Damage detection upfront is becoming more challenging leading to an increase in supplements;
- “Consumers are experiencing longer repair times and increasing repair costs;
- “Claims cycle times and costs are increasing, and as a result, premiums continue to rise; and
- “The presence of more vehicle technology is not significantly reducing claims frequency or accident severity but is increasing overall costs.”
The average newer passenger vehicle has 1,400-1,500 semiconductor chips, while EVs have nearly double that, and roughly 30,000 parts, according to CCC and Economist Writing Every Day.
Electronic components account for 40% of a new vehicle cost including human-machine interfaces, collision warning, driver-assistance safety technologies, advanced driver assistance systems (ADAS), and more, according to CCC.
However, CCC found that at least 13 million collisions still occur yearly.
“…complex vehicles are often trickier to underwrite and fix,” the report states. “This leaves the auto claims and collision repair industries struggling to keep up with the auto industry’s tech transformation, which requires not only new levels of technical expertise but new industry infrastructure to support it.”
CCC says there are three factors to vehicle complexity:
-
- Technology advancements
- Safety systems
- Materials and construction
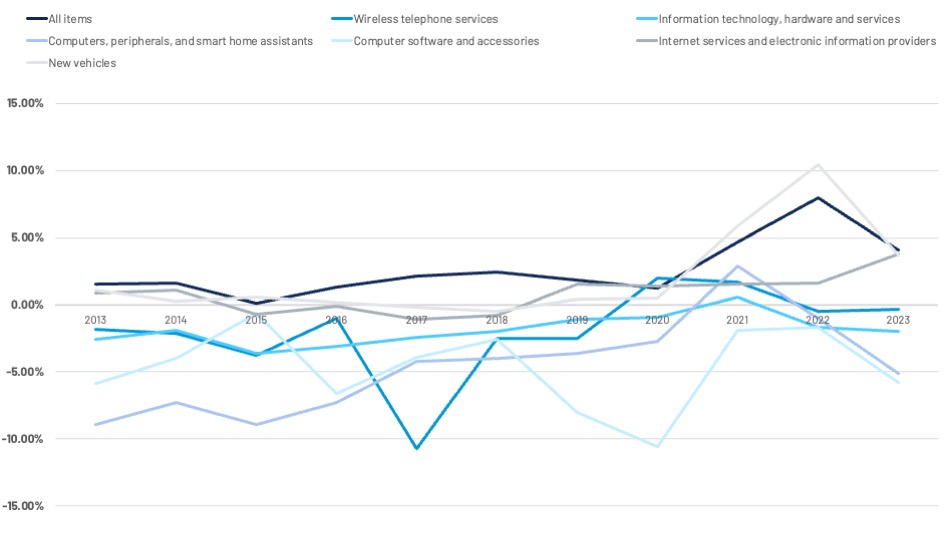
CCC predicts that as OEMs mature and scale their technology, claims and repair costs should even out, based on U.S. Bureau of Labor Statistics inflation data. Data shows the price of new technology eventually decreases as product improvement increases:
The cost differential for repairing older versus newer MY vehicles has grown 35% over the last 10 years, CCC said.
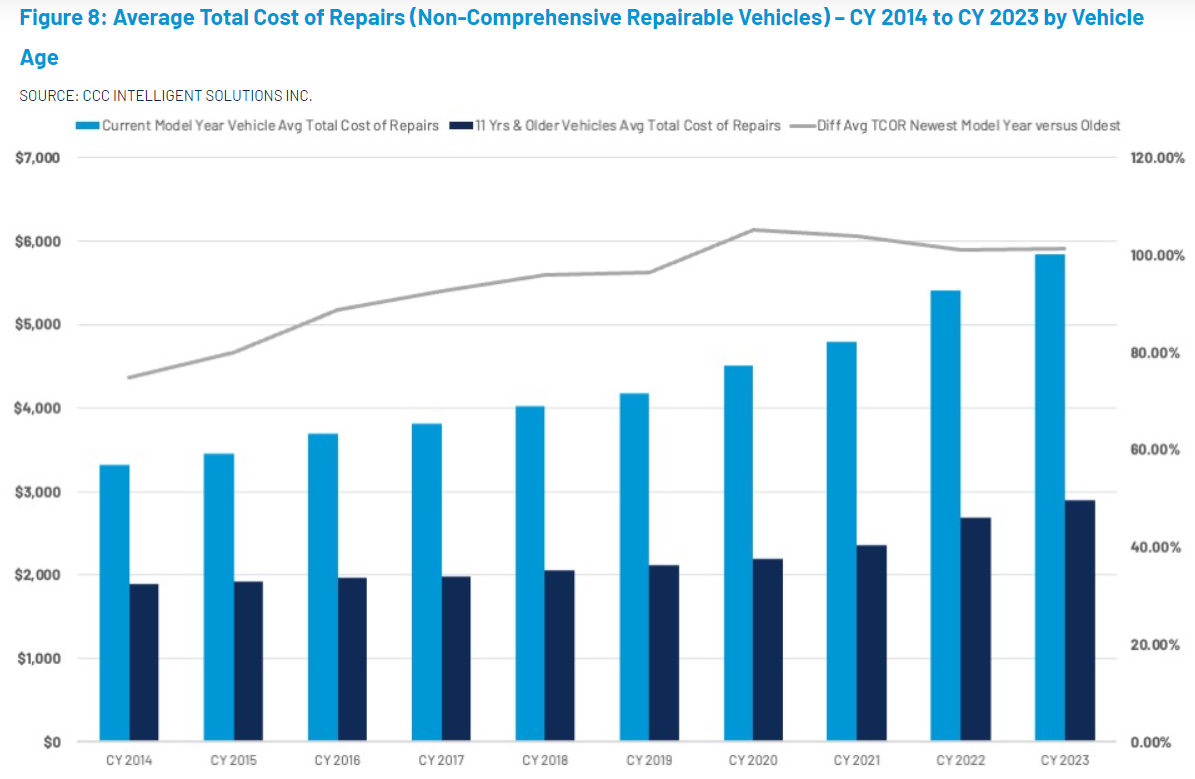
The average age of repairable vehicles was 6.7 years in 2023, and 63.4% were MY 2016 and newer. CCC noted that, over time, the oldest vehicles will be scrapped, shifting even more of the car parc to the newer and more complex vehicles.
As fleets transition from internal combustion engine (ICE) vehicles to EVs, production costs will come down, including as lightweighting grows consistently across the whole fleet, according to CCC.
“EVs also have fewer systems and parts than ICE vehicles, meaning they should become less complex to produce, maintain, and repair over time,” the report says. However, more sophisticated ADAS features could create new vehicle diagnostic challenges for repairers, CCC added.
Other takeaways from the report include:
-
- Research from AAA found that ADAS-equipped vehicles can add up to 37.6% to the total repair cost after a crash due to expensive sensors and calibration requirements.
- According to FastTrack’s paid claim frequency trends, by mid-year of 2023, auto collision frequency had flattened out over the five previously reported quarters. Liability claims frequency has also flattened out over recent quarters and remains well below historic norms.
- CCC data indicates a 1.5%-point increase in total losses last year primarily due to the decrease of used vehicle values and an increasingly mature vehicle pool. About 70% of valuations were vehicles seven years or older.
- An increased total loss frequency will, conversely, decrease the ratio of repairable vehicles. Higher physical damage severity losses, which might have been repaired a year ago, are more likely to now be totaled, increasing shop capacity and lowering overall cycle times.
- Following years of 7.3% and 5.4% increases in average parts costs, the average price per part increased a modest 0.3% in 2023.
- Parts accounted for 43.8% of total repair costs while non-paint labor accounted for the largest contribution increase.
- Labor rates drove the overall repair cost increases which were up 7.4% for the year following a 7% increase in 2022.
Cycle times are slowly improving but both productivity and cycle times still lag behind pre-pandemic levels. The average time vehicles are in the shop following estimate completion is more than 60% longer than before with non-drivable vehicles requiring over 18 days and drivable vehicles almost 28 days.
The adoption of AI and automation tools to speed and inform functions from estimating and scanning to parts ordering continues to grow as the industry looks to offset the effects of labor shortages and the complexity of today’s more sophisticated vehicles, CCC noted.
Crash Course Q1 2024 also includes industry-level detail on claims frequency and impact severity, medical costs, parts costs, total loss trends, and more.
Images
Featured image credit: CCC Intelligent Solutions