
CCC guest column: More issues unseen until supplement; complexity demands dynamic QC checklist
By onBusiness Practices | Market Trends | Repair Operations | Technology
By Susanna Gotsch
Repairing a vehicle and ensuring it is returned to its owner in safe, pre-accident condition has never been easy. As more computers, sensors, substrate metals, new welding and joining techniques, and more are added to vehicles, the repair process has become even more challenging.
Supplement frequency has grown
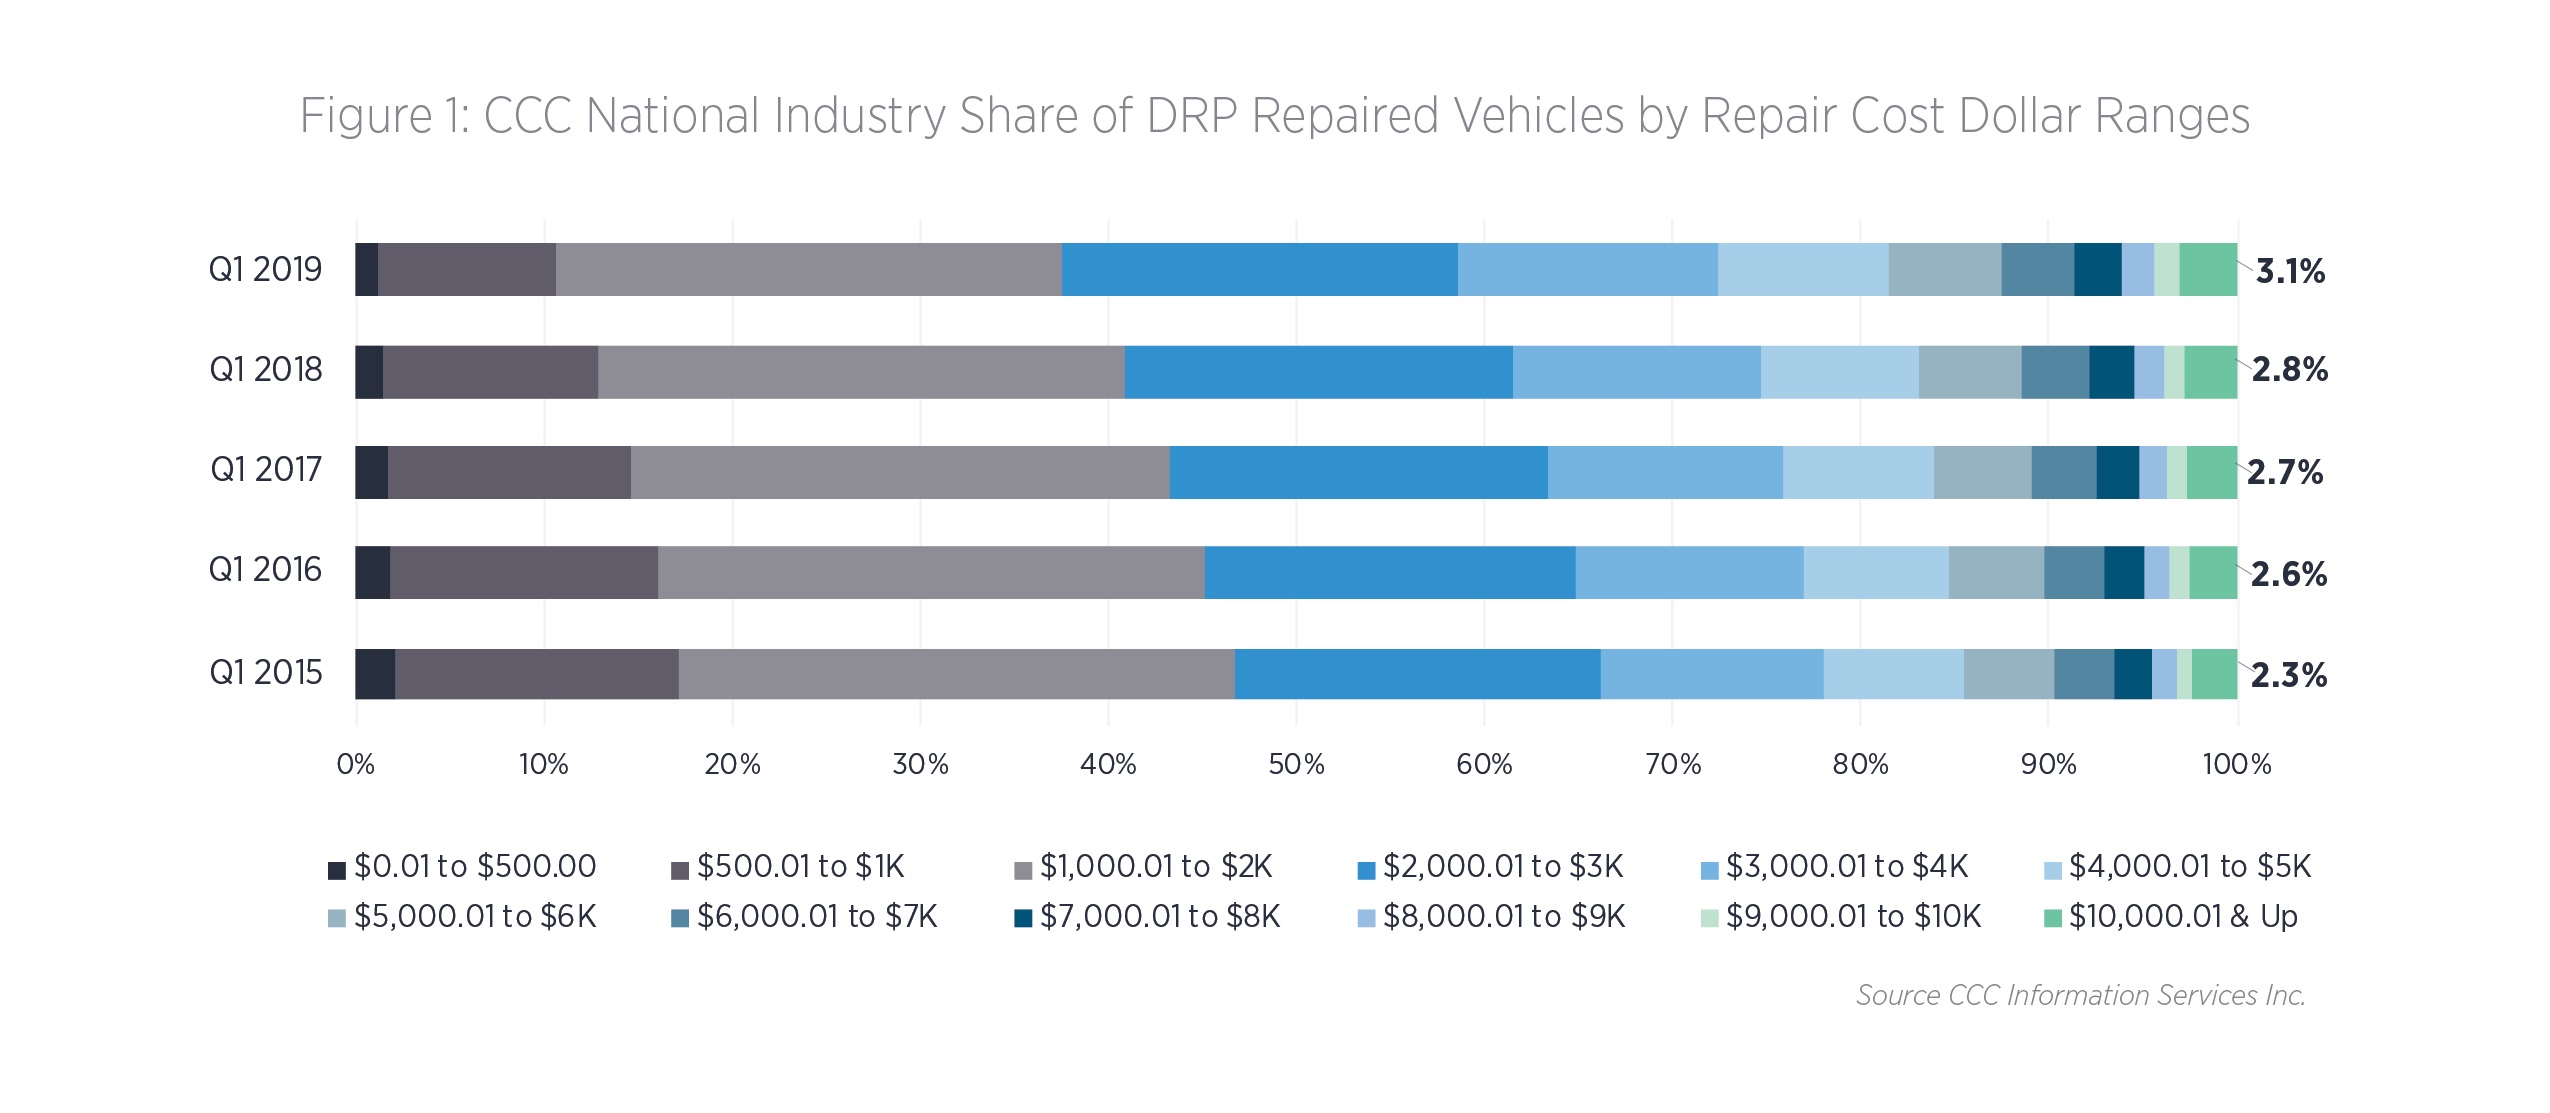
Data on the average repair cost for DRP repairs from Q1 2015 to Q1 2019 reveals how repair costs have shifted higher over the last five years, with more repairs falling in the higher dollar ranges (see Figure 1).
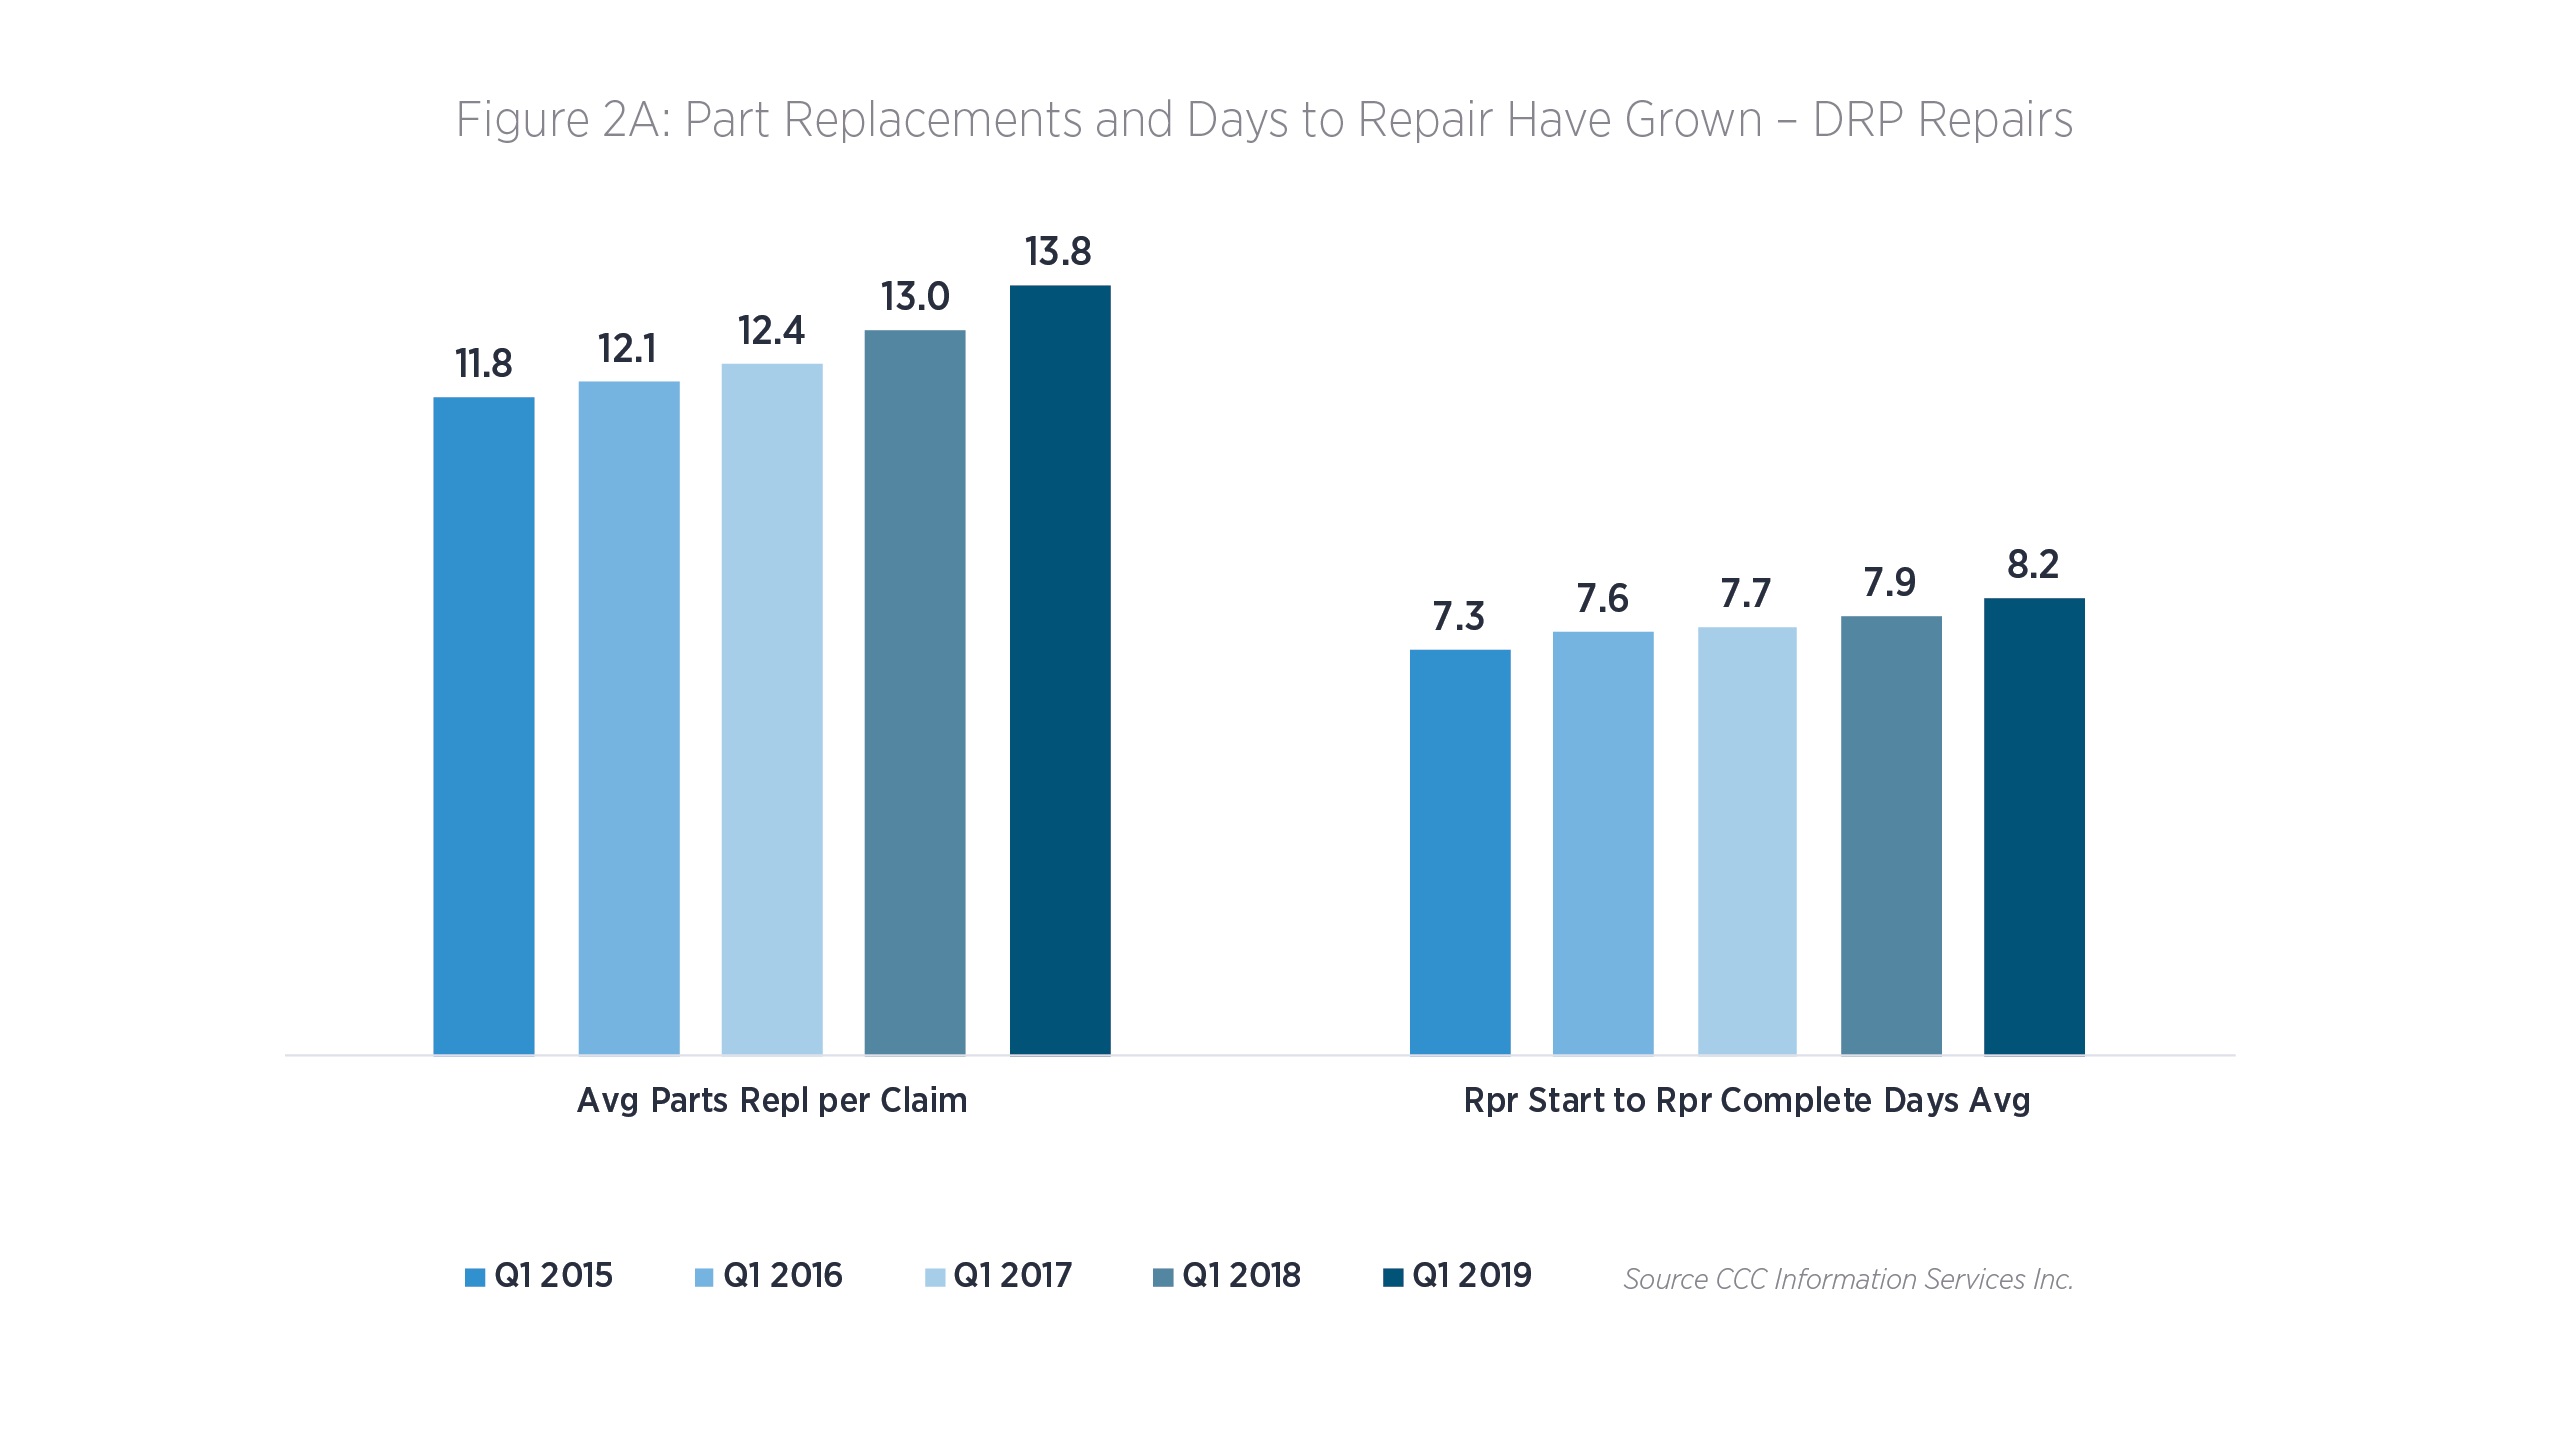
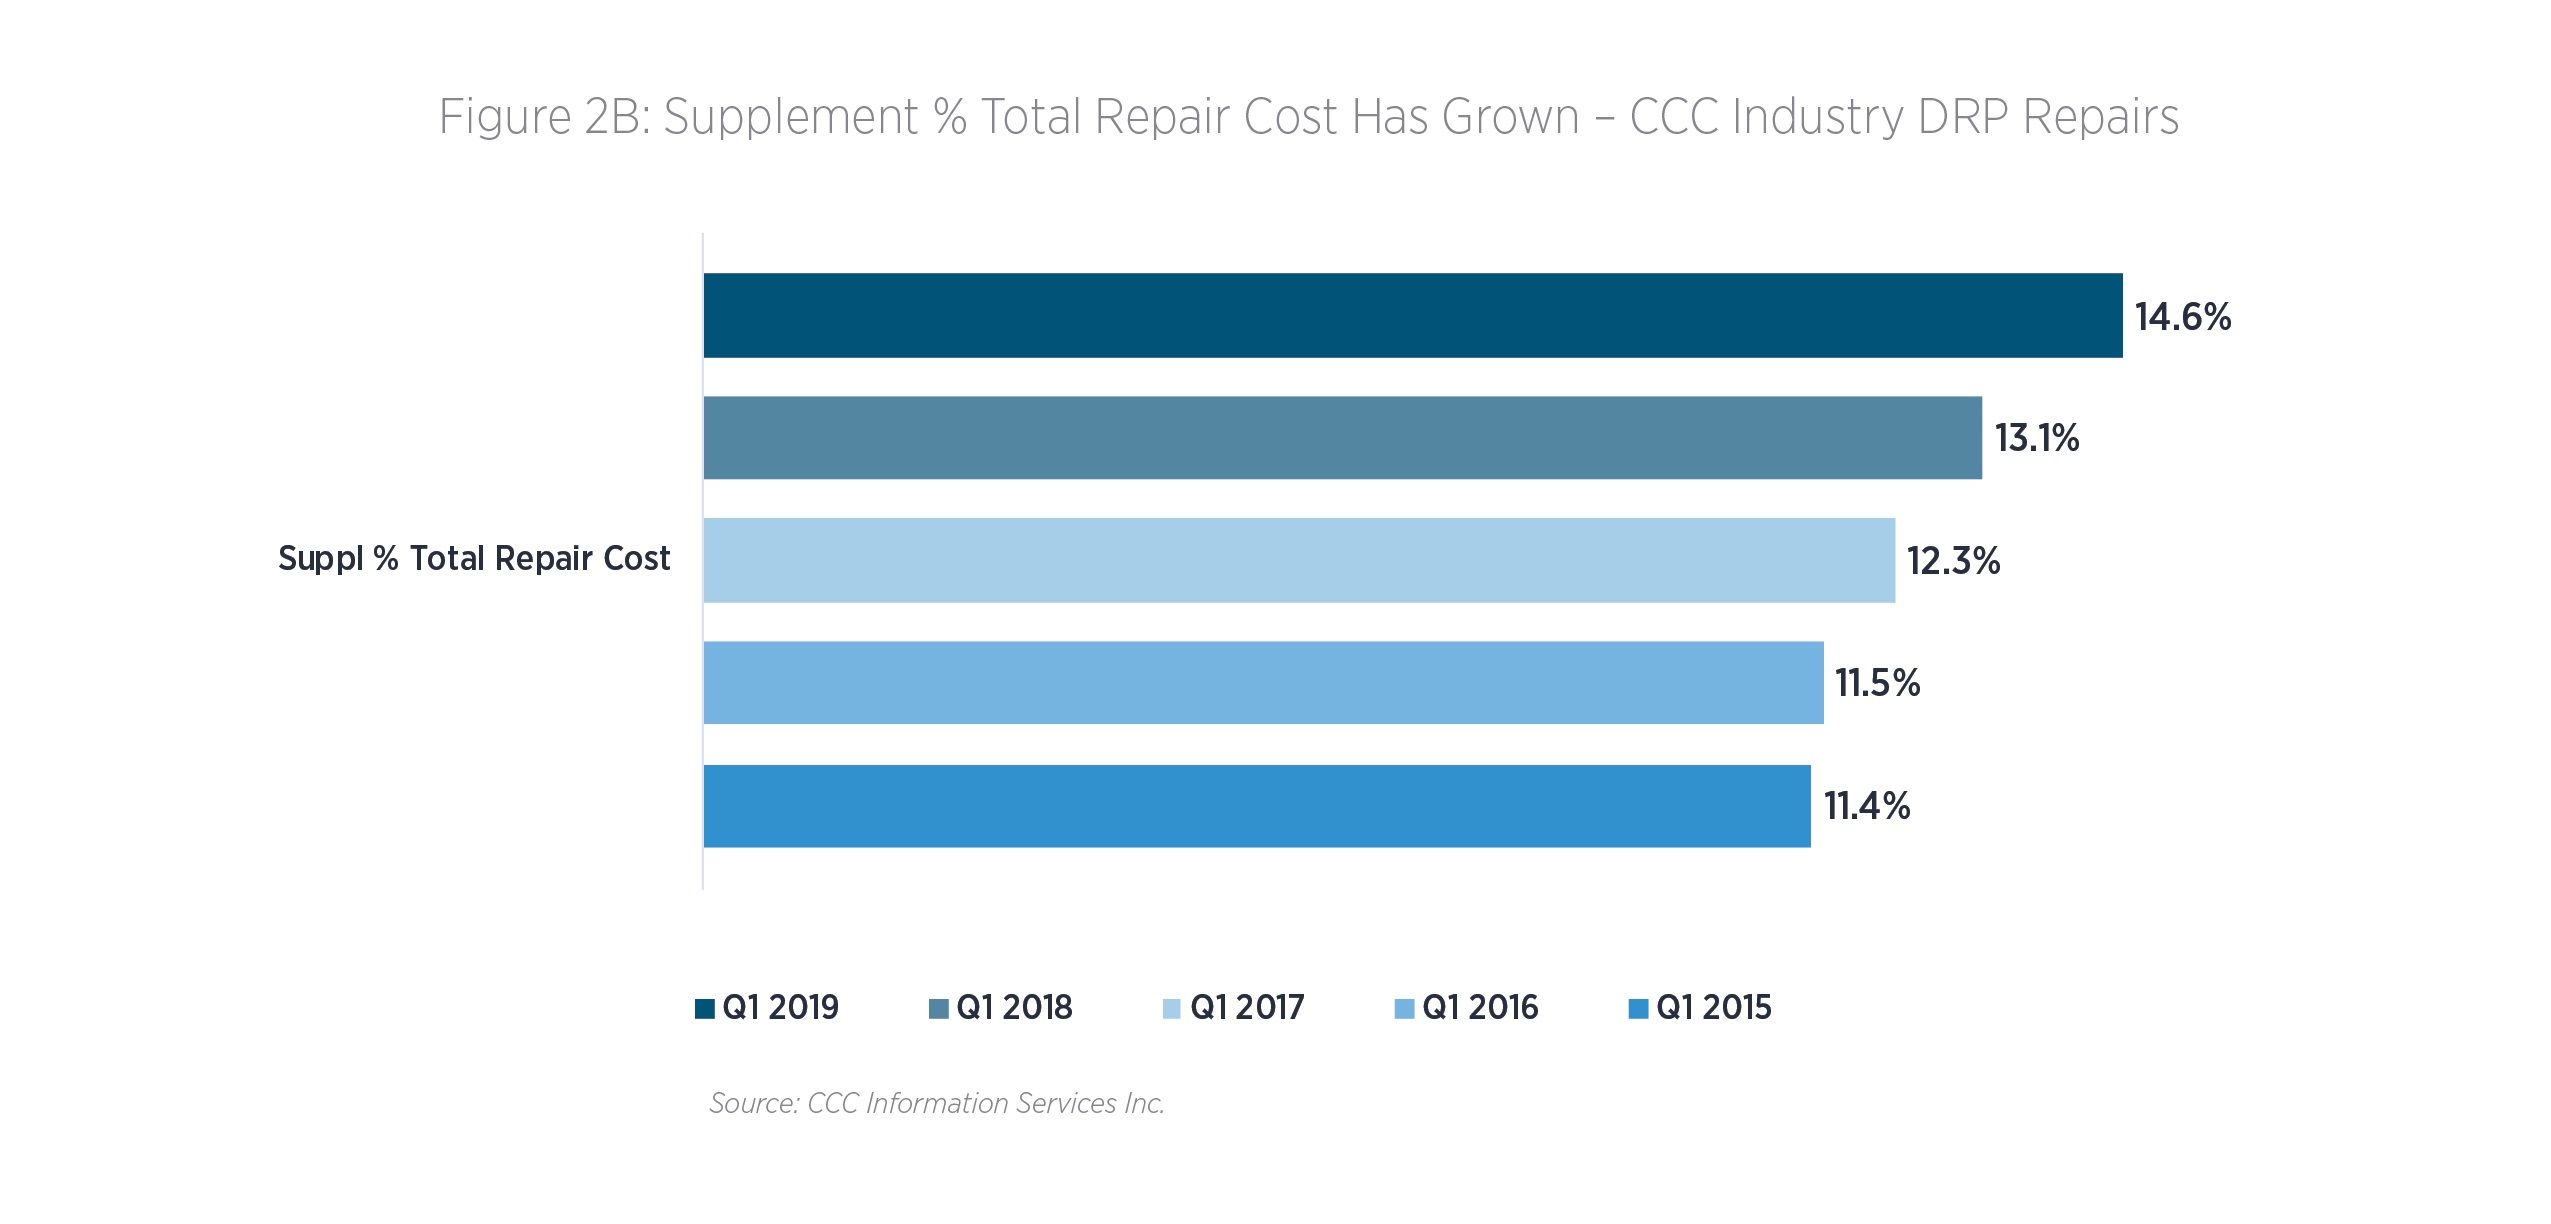
Not surprisingly, much of the increase in the average repair cost is from more part replacements, which in turn drives more labor time, and ultimately overall repair cycle time (see Figure 2A). And, more of the overall repair cost is being identified in the supplements generated once the vehicle repair has begun (see Figure 2B).
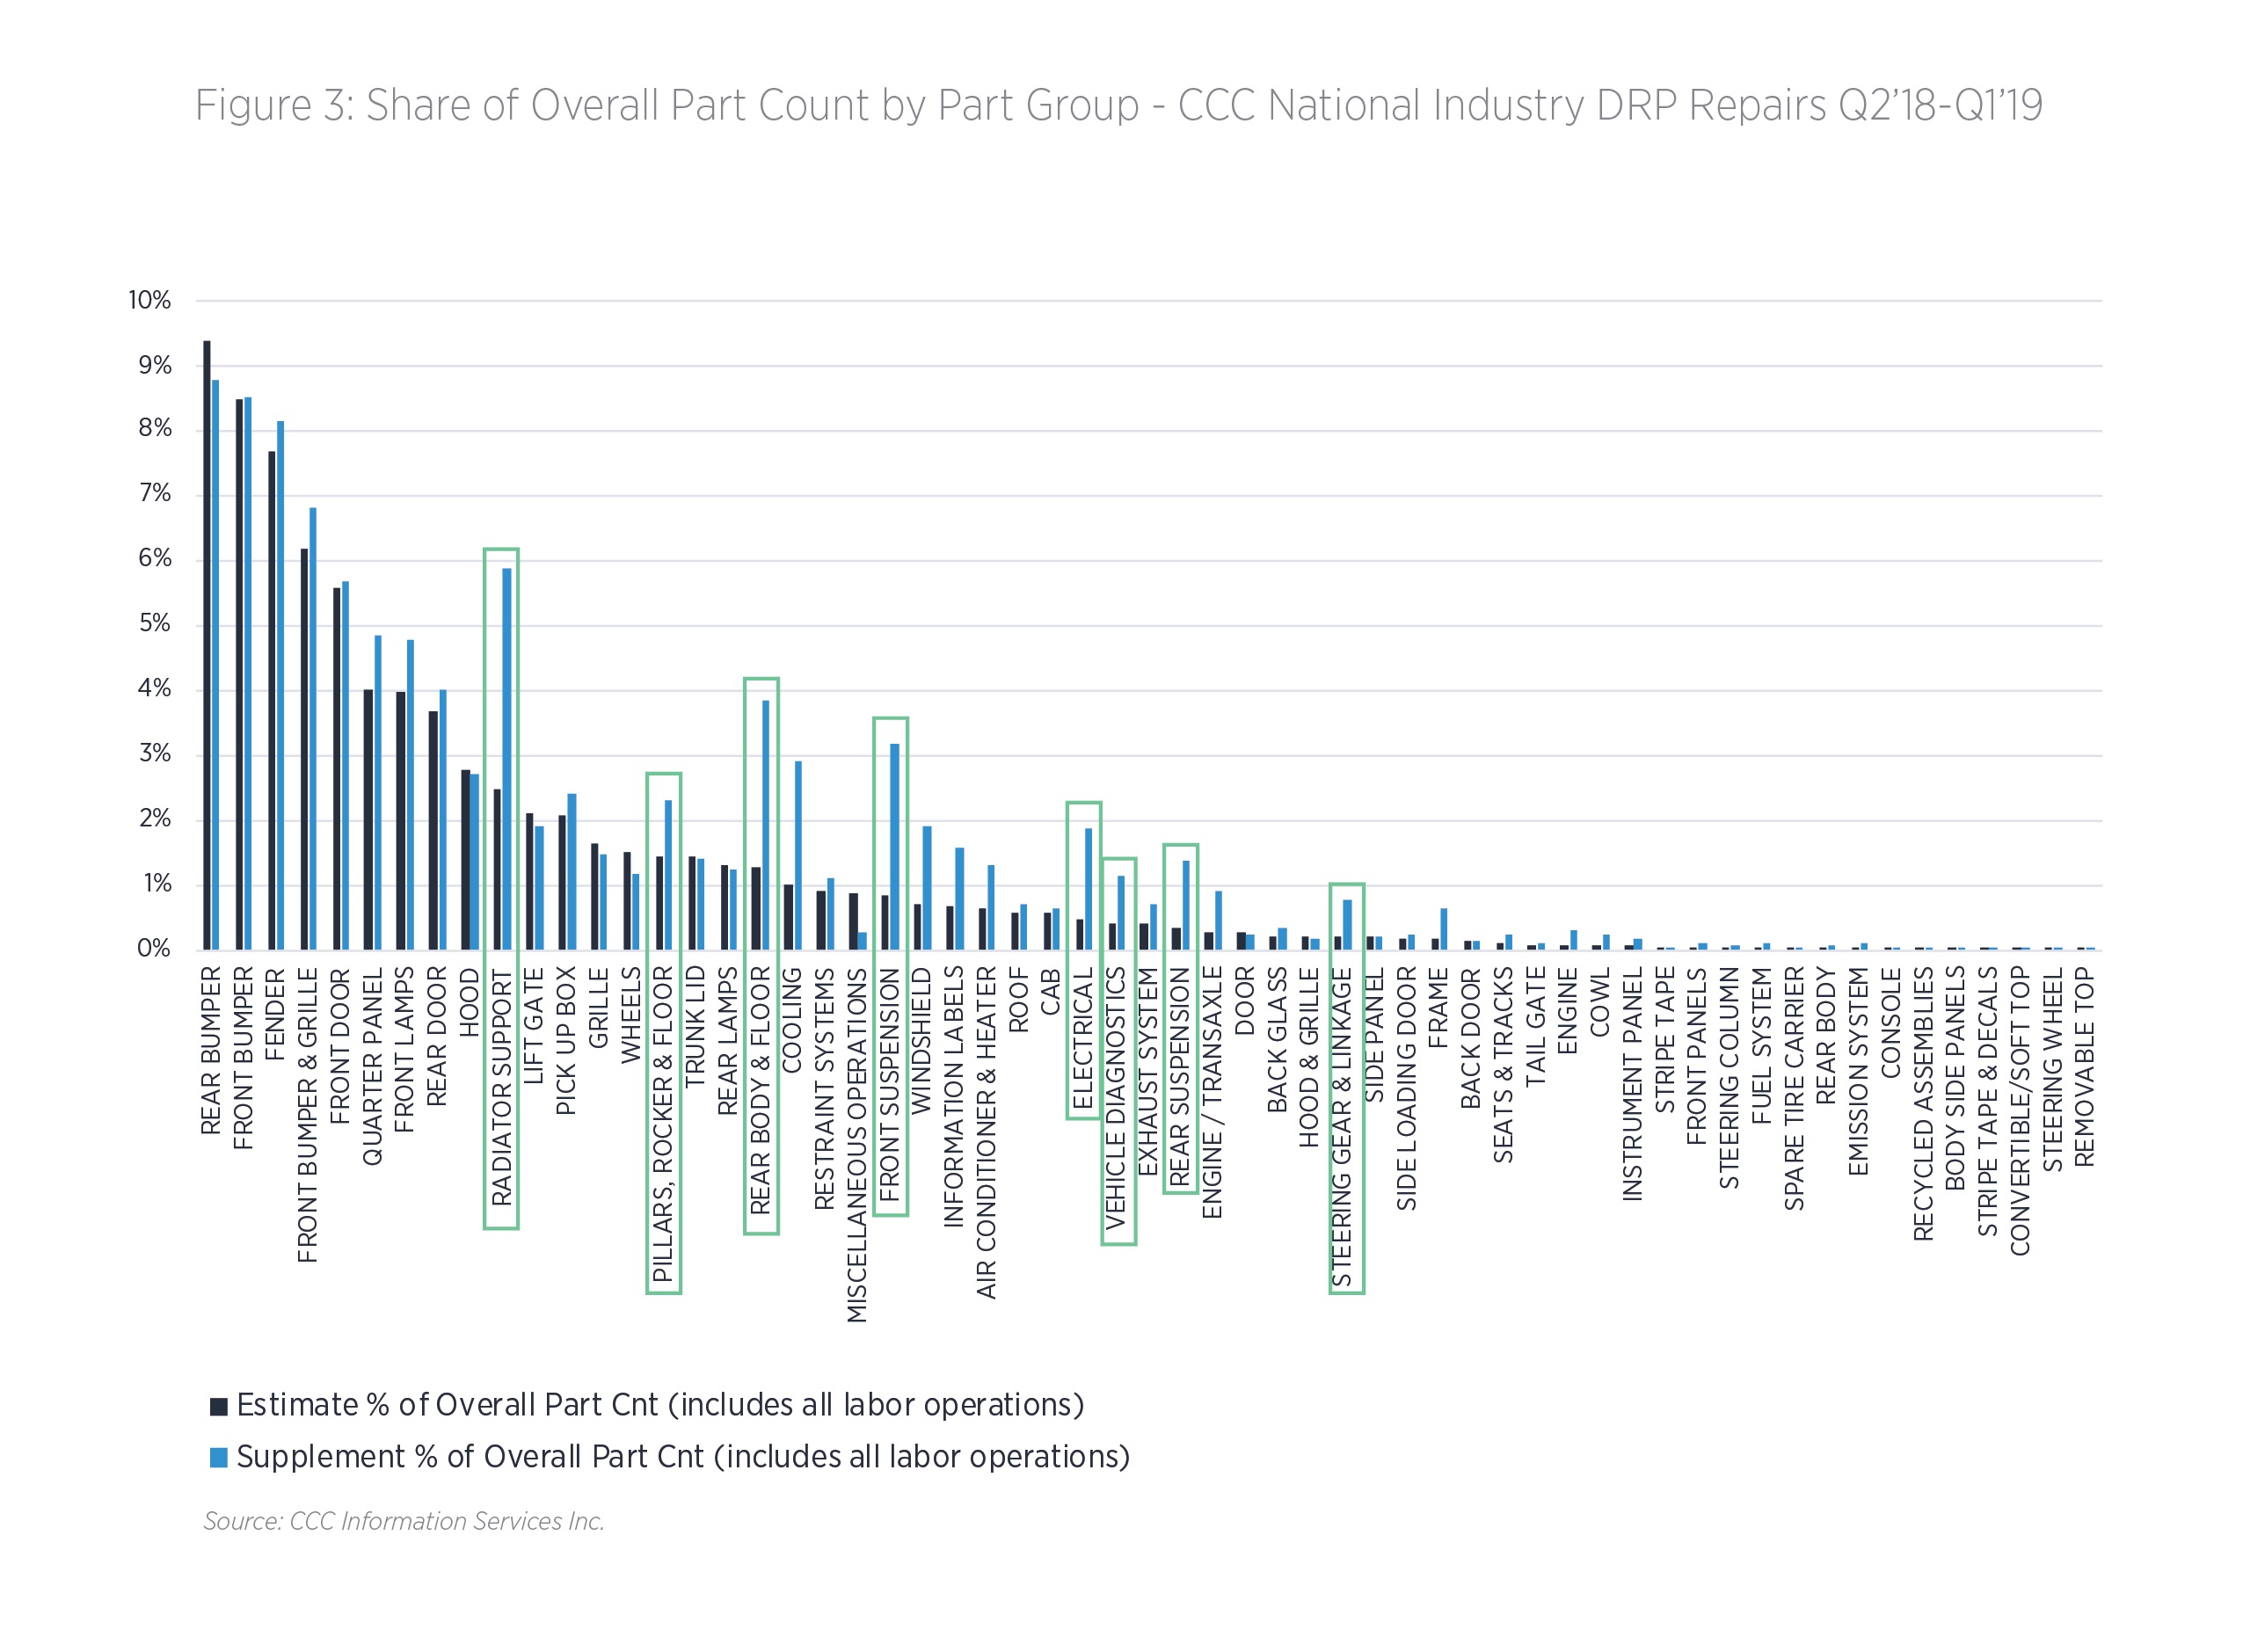
A comparison between original estimates of record (E01) versus all supplements (S01-Snn) of the percent of overall part count included on repairs (includes all labor operations – so parts that have been repaired, R&I’d, replaced, sectioned, etc.) by major part group provides some perspective on where much of the vehicle damage on vehicles occurs, but also which parts may be harder to identify damage during the original estimate (see Figure 3).
For example, while part components in the Radiator Support part group account for 2.5% of all parts included in E01 generated Q2’18-Q1’19, those same parts accounted for well over double (5.9%) of parts included on supplements.
Other part groups seeing larger frequency on supplements than estimates include Rear Body & Floor (1.3% for estimates versus 3.9% for supplements); Front Suspension (0.8% for estimates versus 3.2% for supplements); Electrical (0.5% for estimates versus 1.9% for supplements); and Rear Suspension (0.4% for estimates versus 1.4% for supplements).
Worth noting is those part groups with some of the higher levels of frequency on supplements tend to also require the repairer take additional steps in the repair that may not be included in database labor times, such as test welds and calibration.
As complexity of repairs grows, repairers are increasingly challenged to not only complete thorough and proper repairs, but to also ensure all is documented thoroughly.
Repairer’s unique challenge
The development and implementation of standardized processes to manage complex engineering tasks is not new. Over the last 100-plus years, well-known individuals such as Henry Ford and Edwards Demming have helped introduce more efficient and effective processes to manufacture vehicles with higher quality and more advanced features to meet the needs of demanding consumers. But repairers face a much more unique problem.
During vehicle construction and assembly, people, process and machines are used to perform repetitive tasks that can be easily measured in terms of efficiency and quality. Unfortunately, each vehicle accident is different and has its own unique characteristics.
Repairers must subsequently develop a unique set of steps or repair plan for each individual repair. Because of this, repairers cannot create a one size fits all process.
For example, to properly complete a repair with light bumper damage, a shop may need to perform 15 steps, but a vehicle that has been in a high-speed crash and sustained significant damage may require 110 steps to be completed.
With additional requirements based on the construction and electronic content of the vehicle itself, the insurance company, OE certified program, and/or any regulatory requirements for documentation, there could be potentially millions of combinations of process steps required to properly complete a repair.
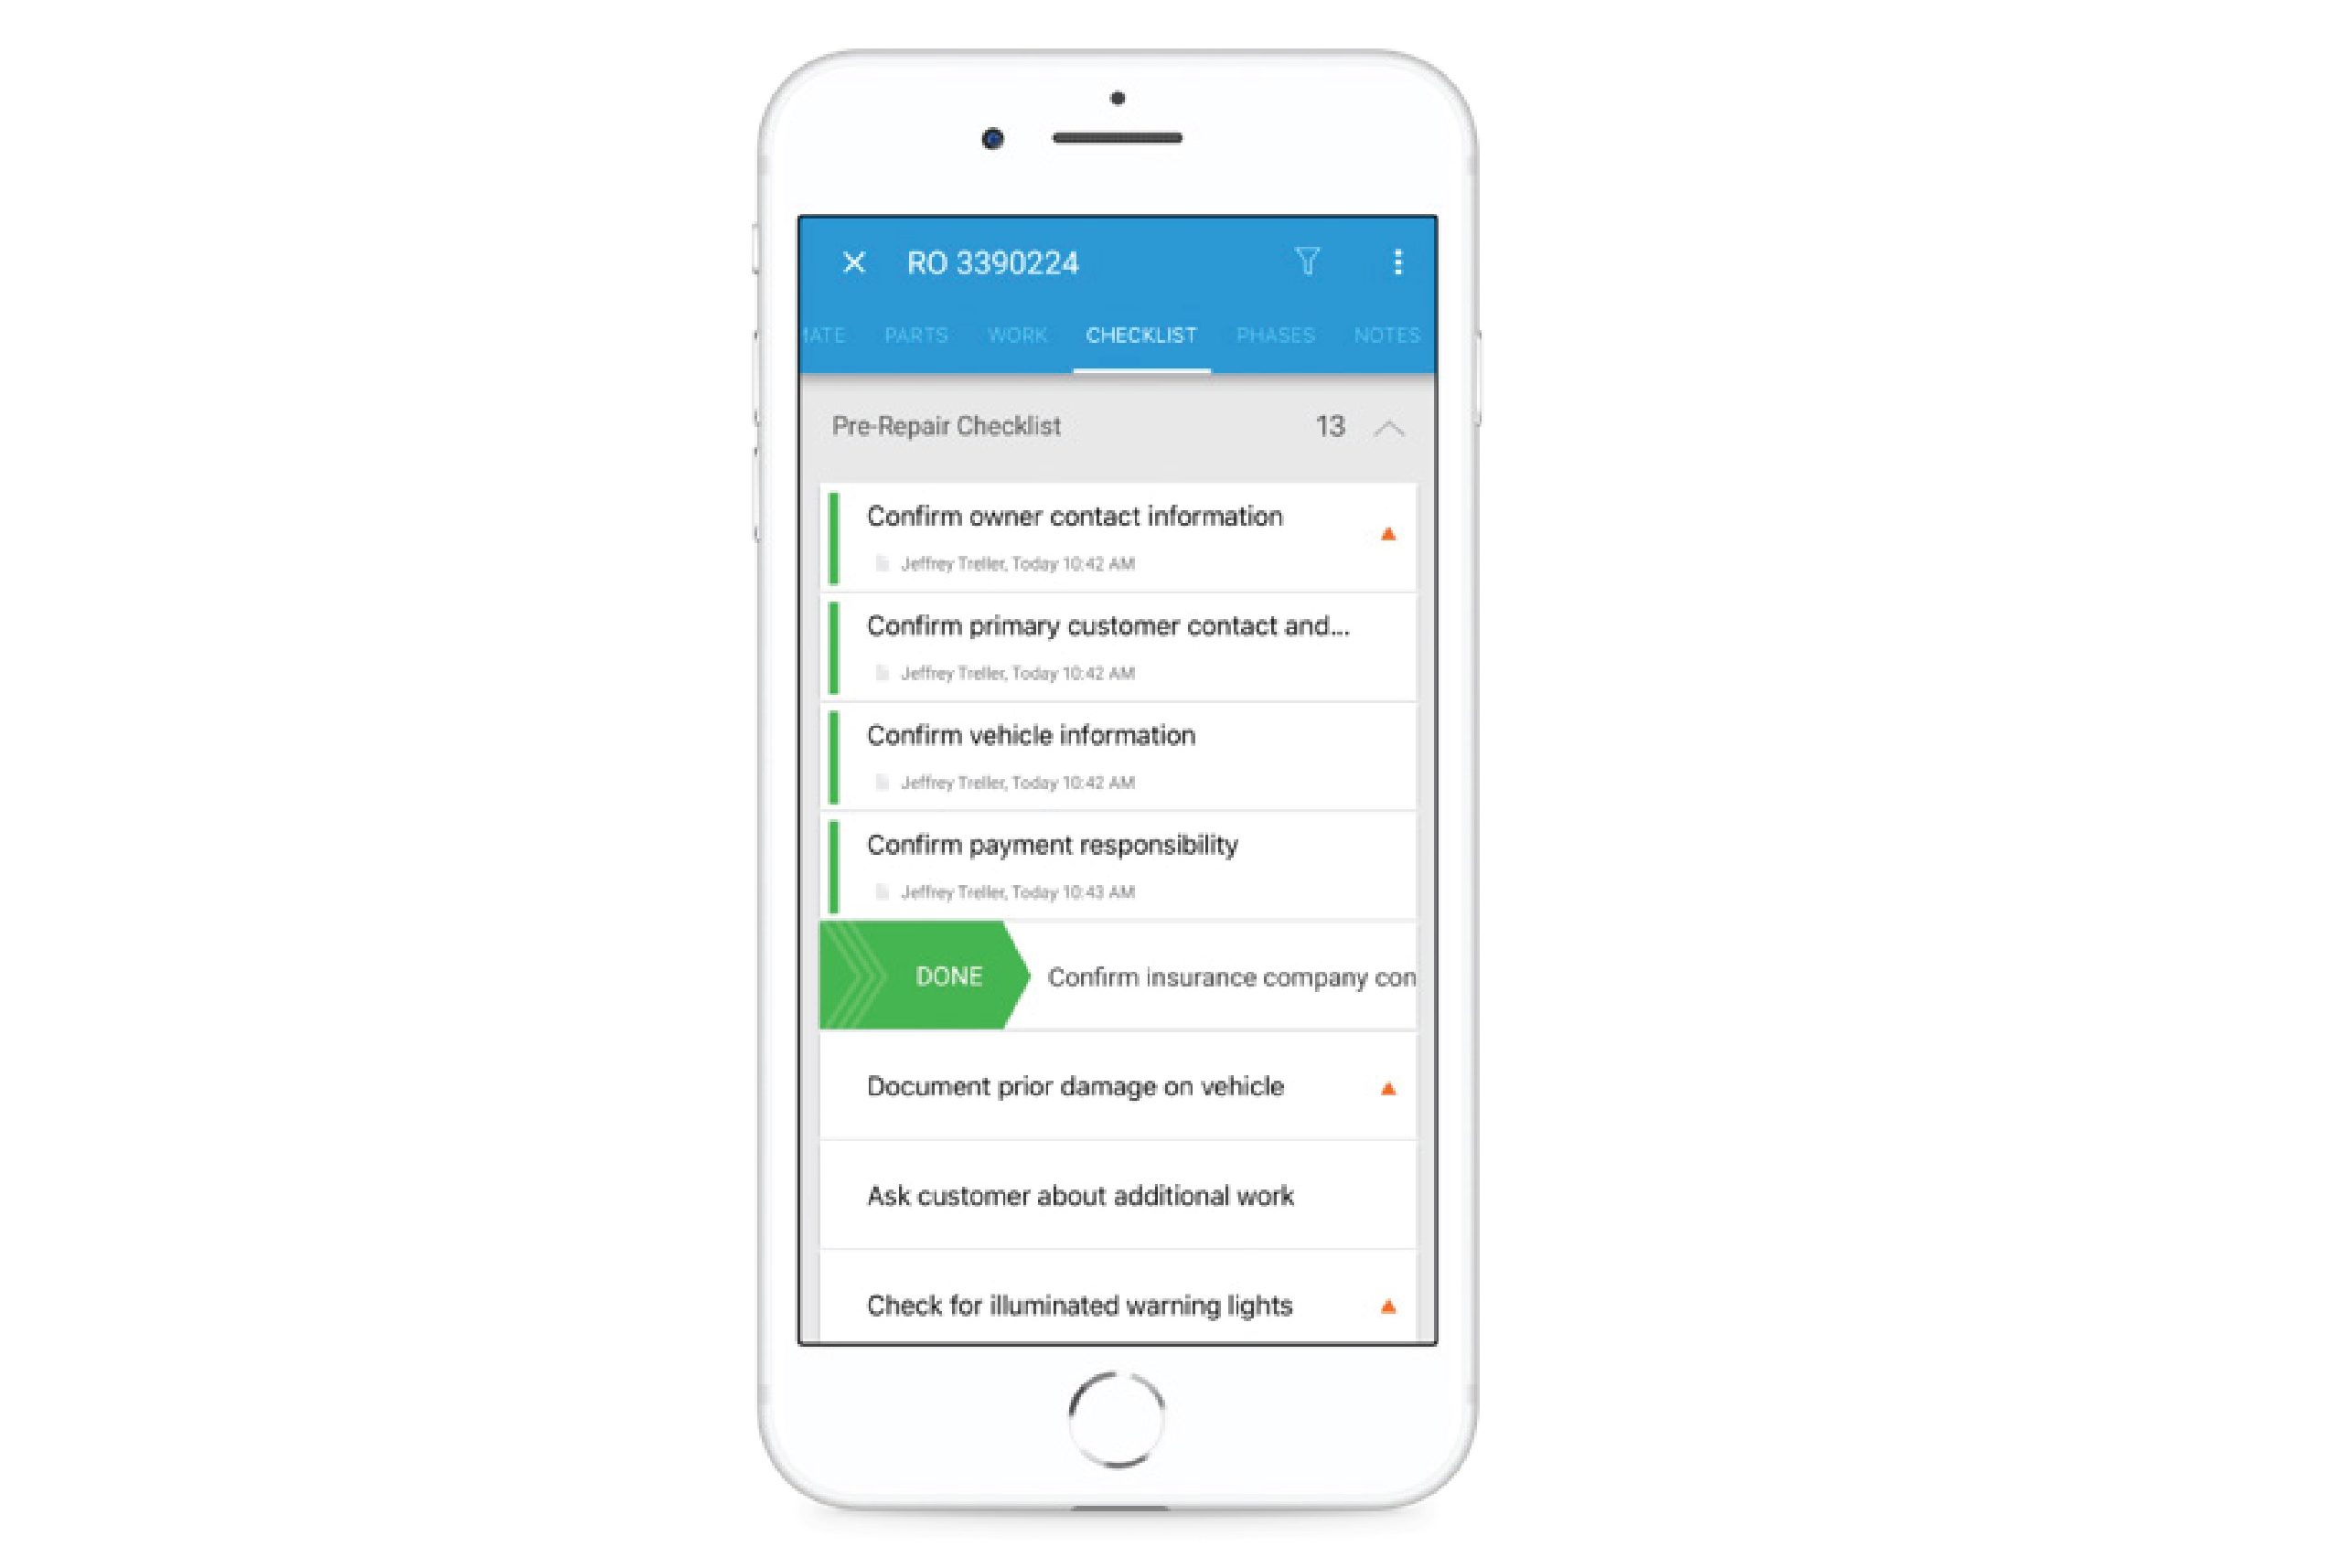
Historically, repairers have relied on a fairly static process to confirm completion of the various steps in the repair process and to document quality checks completed along the way. Many repairers today still use a piece of paper with 50-100 static quality control checklist items and tape it to the windshield of the car. As the vehicle passes through the facility the technicians check off each item as they complete their work or when the vehicle moves to the next phase of production.
With the potential for so many more permutations in the numerous process steps required for today’s repairs, managing that list and ensuring it includes all of the items unique to each repair has become ever more challenging. Repairers need a more dynamic, digital process where each step in the process can be configured based on the type of damage on vehicle, the insurance company, payer type and even a region for MSOs.
For example, a note or photo can be required and captured directly from a phone or tablet, or a step may be marked as pass or fail to measure first time quality throughout the repair lifecycle. Putting technology to support a digital process helps technicians present the right step to the right employee at the right time.
As more and more technology is added to even mainstream vehicles today, it is ever more critical to understand the distinct features of each individual vehicle and its OE recommended repair procedures. Driving this is the growing complexity in both electronic content and material composition and their wide variation among automakers and among individual vehicles.
The growing number of materials being used in vehicle construction and the numerous ways they are being combined has made repair operations like welding more challenging. A proper weld involves the correct type of welder, at the correct settings, with the correct wire, and the correct gas mixture.
Subsequently, more and more OE’s are recommending destructive test welds be performed — an operation considered a non-included operation within the estimating systems — but their importance is key, as a failure to adjust the welder to the correct settings can result in an insufficient weld or weakened metal.
A digital checklist in this scenario can remind the technician that the test-welds need to be completed during a specific stage in the repair process; support his/her ability to document the test-welds have been performed and attach photos and other documentation as proof.
According to Collision Advice and CRASH Networks’ “Who Pays for What: 2018 Frame and Mechanical,” 64 percent of repairer survey respondents never asked to be paid for test welds, compared to 81 percent from the CY 2015 survey.
More electronic content in vehicles also warrants additional steps in the repair to document the condition of the vehicle at drop-off and pickup and complete other tasks such as checking for any warning lights, scanning for DTC’s, and documenting the mileage of the vehicle, especially if the repair warrants the vehicle be driven as part of recalibration. Ensuring these steps are documented consistently and properly is where technology can assist.
As the author of the book The Checklist Manifesto wrote, “Checklists … remind us of the minimum necessary steps and make them explicit. They not only offer the possibility of verification but also instill a kind of discipline of higher performance.”
Images:
Susanna Gotsch is a director and industry analyst at CCC.
CCC argues that repairers need a dynamic checklist because repair complexity can vary. (PashaIgnatov/iStock)
CCC data shows a shift to more expensive repairs at direct repair program shops. (Provided by CCC)
Parts replacement and repair times continued to grow in the first quarter of 2019. (Provided by CCC)
Supplements made up a larger percentage of the total repair cost in the first quarter of 2019. (Provided by CCC)
CCC data shows which parts were being missed on initial estimates on the year ending in the first quarter of 2019. (Provided by CCC)
CCC Checklist software is shown. (Provided by CCC)