CCC: Benchmark report prices aren’t prevailing labor rates or survey results
By onAssociations | Business Practices | Education | Insurance | Market Trends
Repairers have complained to the Society of Collision Repair Specialists that insurers are representing CCC’s industry benchmark reporting as labor rate reports, the trade group said.
The insurers are incorrect, according to CCC.
“CCC does not conduct labor rate surveys or report on prevailing street rates,” the information provider confirmed to us earlier this year.
We asked the estimating service for more information about CCC’s market benchmark reports. CCC answered some, but not all our questions, in the statement it provided in response.
We asked for information about the data set behind the report, including confirmation that it represents anything found on an estimate written in CCC. We sought confirmation this meant the data set could include initial insurance or independent appraiser estimates with hypothetical rates, shop estimates written with door rates, and DRP shop estimates written with contractual rates rather than door rates.
“CCC provides benchmark reports based on an aggregation of industry data collected from customers that use CCC’s collision estimating software and/or communicate electronic appraisals via CCC’s CCC ONE® Workflow network,” CCC said in the statement.
Thus, the market data isn’t a true reflection of collision repair business posted rates, and should not be relied upon for that use. Remember, CCC said it “does not conduct labor rate surveys or report on prevailing street rates.”
Regarding a question on who could order such benchmark reports, CCC wrote: “Reports are available within CCC ONE and accessible to system users, including collision repair and insurance customers.”
CCC didn’t specifically address our questions about the function of those reports and how the data definition and limitations were communicated to the report recipient.
The information provider’s full statement in response to our inquiry stated:
CCC provides benchmark reports based on an aggregation of industry data collected from customers that use CCC’s collision estimating software and/or communicate electronic appraisals via CCC’s CCC ONE® Workflow network. Reports are available within CCC ONE and accessible to system users, including collision repair and insurance customers. CCC does not conduct labor rate surveys or report on prevailing street rates.
Last year, CCC provided a similar answer back to SCRS, which had been working with the information provider to understand and resolve the problem since 2018.
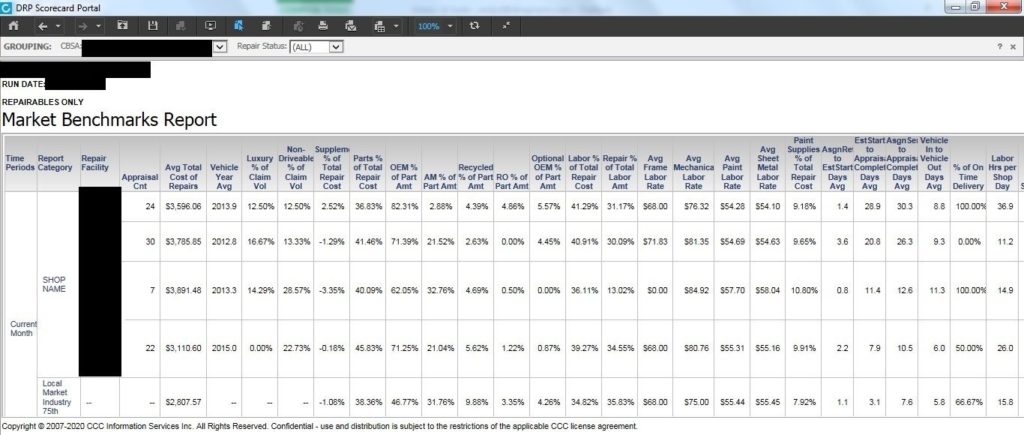
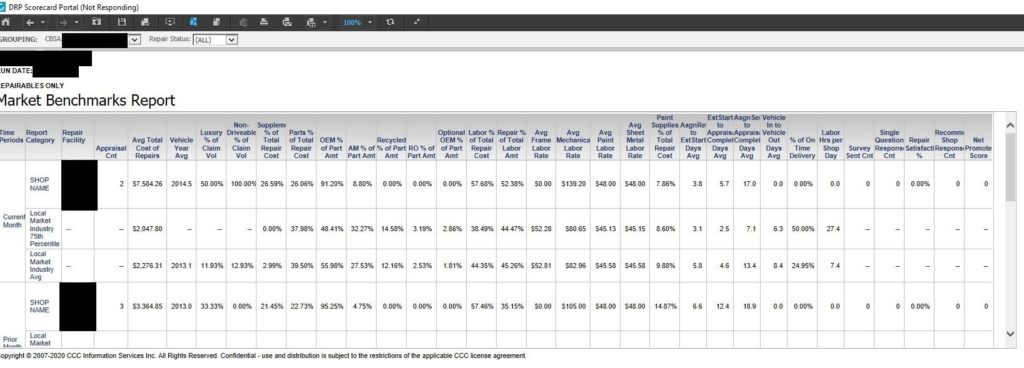
SCRS said CCC has communicated to the association that insurer-facing reports do contain a disclaimer that the benchmark reports aren’t a labor rate survey. It also alleged CCC wouldn’t provide proof of this language on an insurer report. Based on screenshots a source provided to Repairer Driven News, the repairer-facing versions don’t seem to feature this message.
We asked CCC about all of this and about any other differences in the insurer and repairer content. The information provider referred us to its prior statement.
Lee’s Garage owner Paul Sgro on Tuesday said he’s repeatedly experienced insurers challenging his rates, citing CCC’s data as something it’s not.
He described an interaction: An insurer representative asks him his ZIP code, then claims to pull up the area’s labor rate on CCC. The carrier will describe it as their “guidelines,” and when Sgro asks to see a copy of the data, they’ll refuse.
He’ll challenge the interpretation of the CCC results as a true market rate: “‘That’s not true.'” The response: “This is how we get our information.”
Sgro called Allstate the primary offender, but he said he’s now finding “multiple carriers saying the same thing.”
“It’s just frustrating,” he said.
He recalled an experience with an Allstate representative asserting that the state “‘only allows this (rate)'” for Sgro’s area. The insurer called that the information it had received from CCC.
As noted above, CCC told SCRS that insurer market benchmark reports carry a disclaimer saying specifically that the information is not what carriers have been representing it as.
We shared this information, CCC’s response to us and Sgro’s account with Allstate on Wednesday morning, noting that this suggested a rather blatant use of CCC’s data out of context. Allstate has not yet responded.
Haury’s Collision Center President Jeff Butler reported a similar situation to CCC itself back in 2018.
“As I mentioned, some insurance companies have stated to our repair facility and our customers they use market pricing information from CCC1 to establish what they call, ‘the prevailing labor rate’ is in a geographic market as your software is utilized by many automotive repair facilities,” Butler wrote to a CCC client services advisor.
“Pursuant to that topic, I am requesting a report showing what the range of “labor rates” are charged in the Seattle area for auto repair. Please break down the information by zip code as well as the type of repair facility (Auto Dealer and/or OEM certified, Independent repair shop, Insurance DRP, shops with other types of certifications. (obviously, the name of the repair shops doesn’t need to be on the list nor am I requesting any consumer information)
“Shopping the competition and knowing what businesses charge for their services is not in any way price fixing and you are currently providing this information to insurers so I think it’s fair to provide the same to repair facilities as well.”
Butler followed up in January of this year. The CCC client services advisor provided the following response:
CCC does not provide labor rate surveys reports. CCC only provides insurers with claim related data and this data is not intended to be used for labor rate surveys. This is clearly stated on every report we provide that contains an aggregated average labor rate for insurance claims (only). Industry reporting provided by CCC is an aggregation of industry data collected from customers that use CCC Estimating collision estimating software and/or communicate electronic appraisals via CCC’s network, where data has been aggregated by certain geographic areas.
Average labor rates for your market may be found in the CCC Indicators dashboard. Select Indicators from the dashboard menu in CCC ONE. Then click the “View Standard Indicators Detail” link at the top. Select the Market Benchmarks Report and scroll to the right where you will see the average labor rates for your facility as well as the average for your local CBSA (core based statistical area). (Emphasis CCC’s.)
The CCC advisor told Butler that the Indicators option was “only available to CCC customers who are actively subscribed to our INNOVATE or PERFORM packages. For elaboration on what these packages entail, they are geared towards repair facilities who have active DRP programs, as they contains tools to assist those facilities in writing estimates within the guidelines they have agreed upon with those insurance carriers. The indicators dashboard is one of those tools, as it aggregates data uploaded to CCC’s servers for those claims and assignments completed by the repair facility.”
The repairer-facing version of the CCC benchmark reports also contains a data point for the 75th percentile, which means a quarter of shops in the area posted even higher values.
“CCC redacts the top 25% of rates off their reporting and only reports on the lower 75th percentile, without explanation of what this means,” SCRS argued in an email. “This clearly influences the application of the information.”
Screenshots from a DRP Scorecard Portal shop-facing report find one repairer charging $48 for body work on estimates. The 75th percentile is said to be $45.15. That means 25 percent of the competition still charges more. If it turns out the repairer’s $48 puts it in the 80th percentile, then 20 percent of shops in the area are still charging more.
A case could be made this too is reasonable. (One proposed test of reasonableness has been two standard deviations, which on a pure bell curve would mean around 95 percent of shops’ rates would be considered reasonable.)
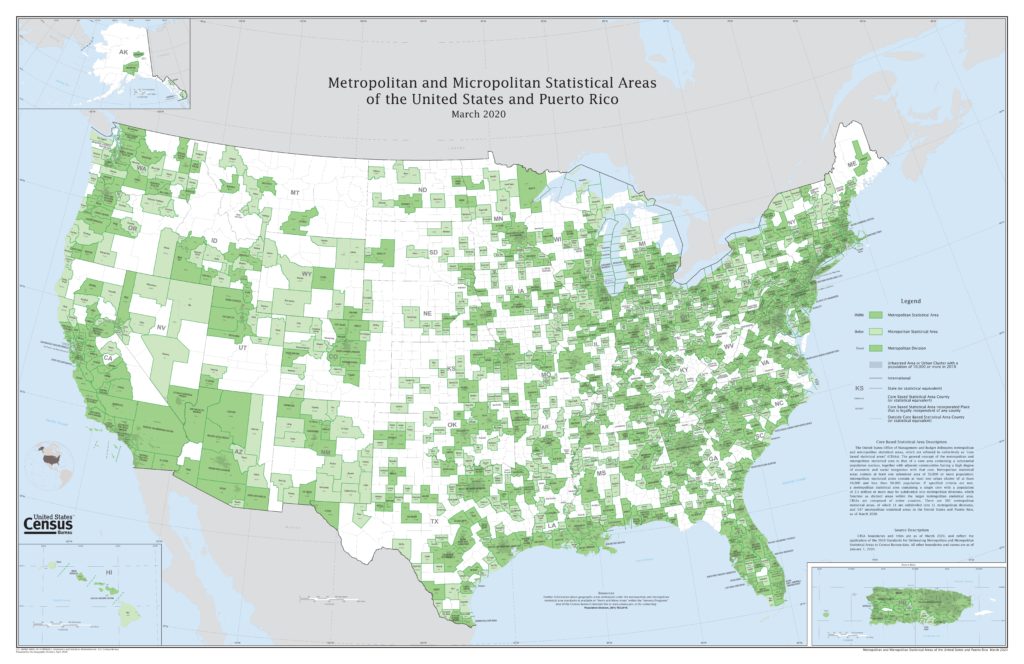
It’s also worth noting that screenshots from shop-facing benchmark version shared with us and the CCC communication with Butler suggests the potential of the reports grouping shops into a federal “core-based statistical area.”
The government recognizes two types of “core-based statistical areas”: metropolitan and micropolitan. Metropolitan areas have an urban core of 50,000 or more people; micropolitan ones have an urban core of between 10,000 and 49,999.
“OMB establishes and maintains these areas solely for statistical purposes,” the Office of Management and Budget wrote in 2010. “In reviewing and revising these areas, OMB does not take into account or attempt to anticipate any public or private sector nonstatistical uses that may be made of the delineations. These areas are not designed to serve as a general-purpose geographic framework applicable for nonstatistical activities or for use in program funding formulas.” (Emphasis OMB’s.)
These areas can be larger than a city or single county, and it seems to absurd to think of some of them represent a realistic auto body repair market. Customers are unlikely to travel such distances to obtain body work, and an overly large area would include shops in different jurisdictions subject to different regulations and costs of living — i.e., different market conditions.
For example, the metropolitan area including our home base of Kentwood, Mich., spanned four counties as of March 2020. The one for Minneapolis, Minn., covers more than a dozen counties — including some in Wisconsin. One CBSA encompasses all of Rhode Island and a piece of Massachusetts. Click on the map above and zoom in on the PDF to see your region.
Images:
The CCC booth at SEMA 2019 is shown. (John Huetter/Repairer Driven News)
A source provided this example of a shop-facing CCC DRP Scorecard Portal benchmark report. CCC says such reports aren’t labor rate surveys or prevailing rate information. (CCC screenshot; redactions by source, Repairer Driven News)
The core-based statistical areas of the U.S. as of March 2020 are shown. (Census Bureau)


