CCC, Mitchell analyze trends affecting insurance, repair industries
By onAnnouncements | Collision Repair | Insurance | Market Trends
The number of auto insurance collision claims filed in 2021, though rising, remains below pre-pandemic figures, while average claim costs have increased, industry information providers CCC and Mitchell have reported in their examination of trends affecting the insurance and repair industries.
The two companies’ analysts pointed to profound changes in driving patterns and rising parts prices, both affected by COVID-19, as key issues likely to continue in the months ahead.
However, the two differed on some of the drivers of change. CCC, for instance, delved deeply into the pandemic’s effect on traffic patterns and their impact on increased accident severity, while Mitchell — whose report was issued under the name of its parent company, Enlyte — examined the “urban exodus” that work-from-home has fueled.
The two also agreed that parts prices have risen, but differed in their focus on the causes, with CCC keying in on supply-chain disruptions, and Mitchell more deeply examining the effect of inflation on the cost of raw materials.
CCC’s report, “The Continued and Forecasted Impact of the Pandemic on the P&C Insurance Economy,” and Enlyte’s report, “Enlytened: 2021 Trends Report,” were released within days of each other. The report focusing on Mitchell data, “Three Economic Trends Transforming Auto Insurance,” is one of seven chapters in a document that also presents findings from Enlyte’s Genex and Coventry divisions.
First, two conclusions
The reports sounded similar themes in their conclusions.
 “The COVID-19 pandemic resulted in unprecedented declines in miles driven in CY 2020 and changing traffic patterns in CY 2021 that may be temporary or permanent,” CCC industry analyst Susanna Gotsch concluded. “Many companies continue to keep those employees that can work remote out of the office, delaying earlier plans to return employees to the office in Q4 2021 to early CY 2022. These new traffic patterns have resulted in more severe auto accidents and higher fatality and injury rates despite lower claims overall than the CY 2019 pre-pandemic benchmark.
“Supply disruptions from COVID-19 continue to drive higher inflation in raw materials and labor shortages and resultant higher wages continue to plague many industries, and no clear end is in sight. Businesses continue to adapt, and resilience and innovation remain essential. Moving forward, businesses will need to further evaluate key issues like supply-chain sourcing, hybrid work, and how to best take advantage of rapidly evolving technologies like digital, AI, mobile and cloud to improve collaboration and drive efficiencies back into the process,” Gotsch wrote.
 “While last year’s shelter-in-place restrictions changed consumer preferences and accelerated virtual claims handling, they also affected miles driven, accident frequency and policyholder premiums,” concluded Ryan Mandell, the director of claims performance for Mitchell’s Auto Physical Damage division. “Now, after nearly two years, the economy is slowly rebounding, even in spite of the Delta variant. However, COVID-19’s influence on commute patterns, population redistribution and the current price of raw materials promises to have a long- lasting impact on automotive claims and proper, safe vehicle repair.”
Claims on the increase
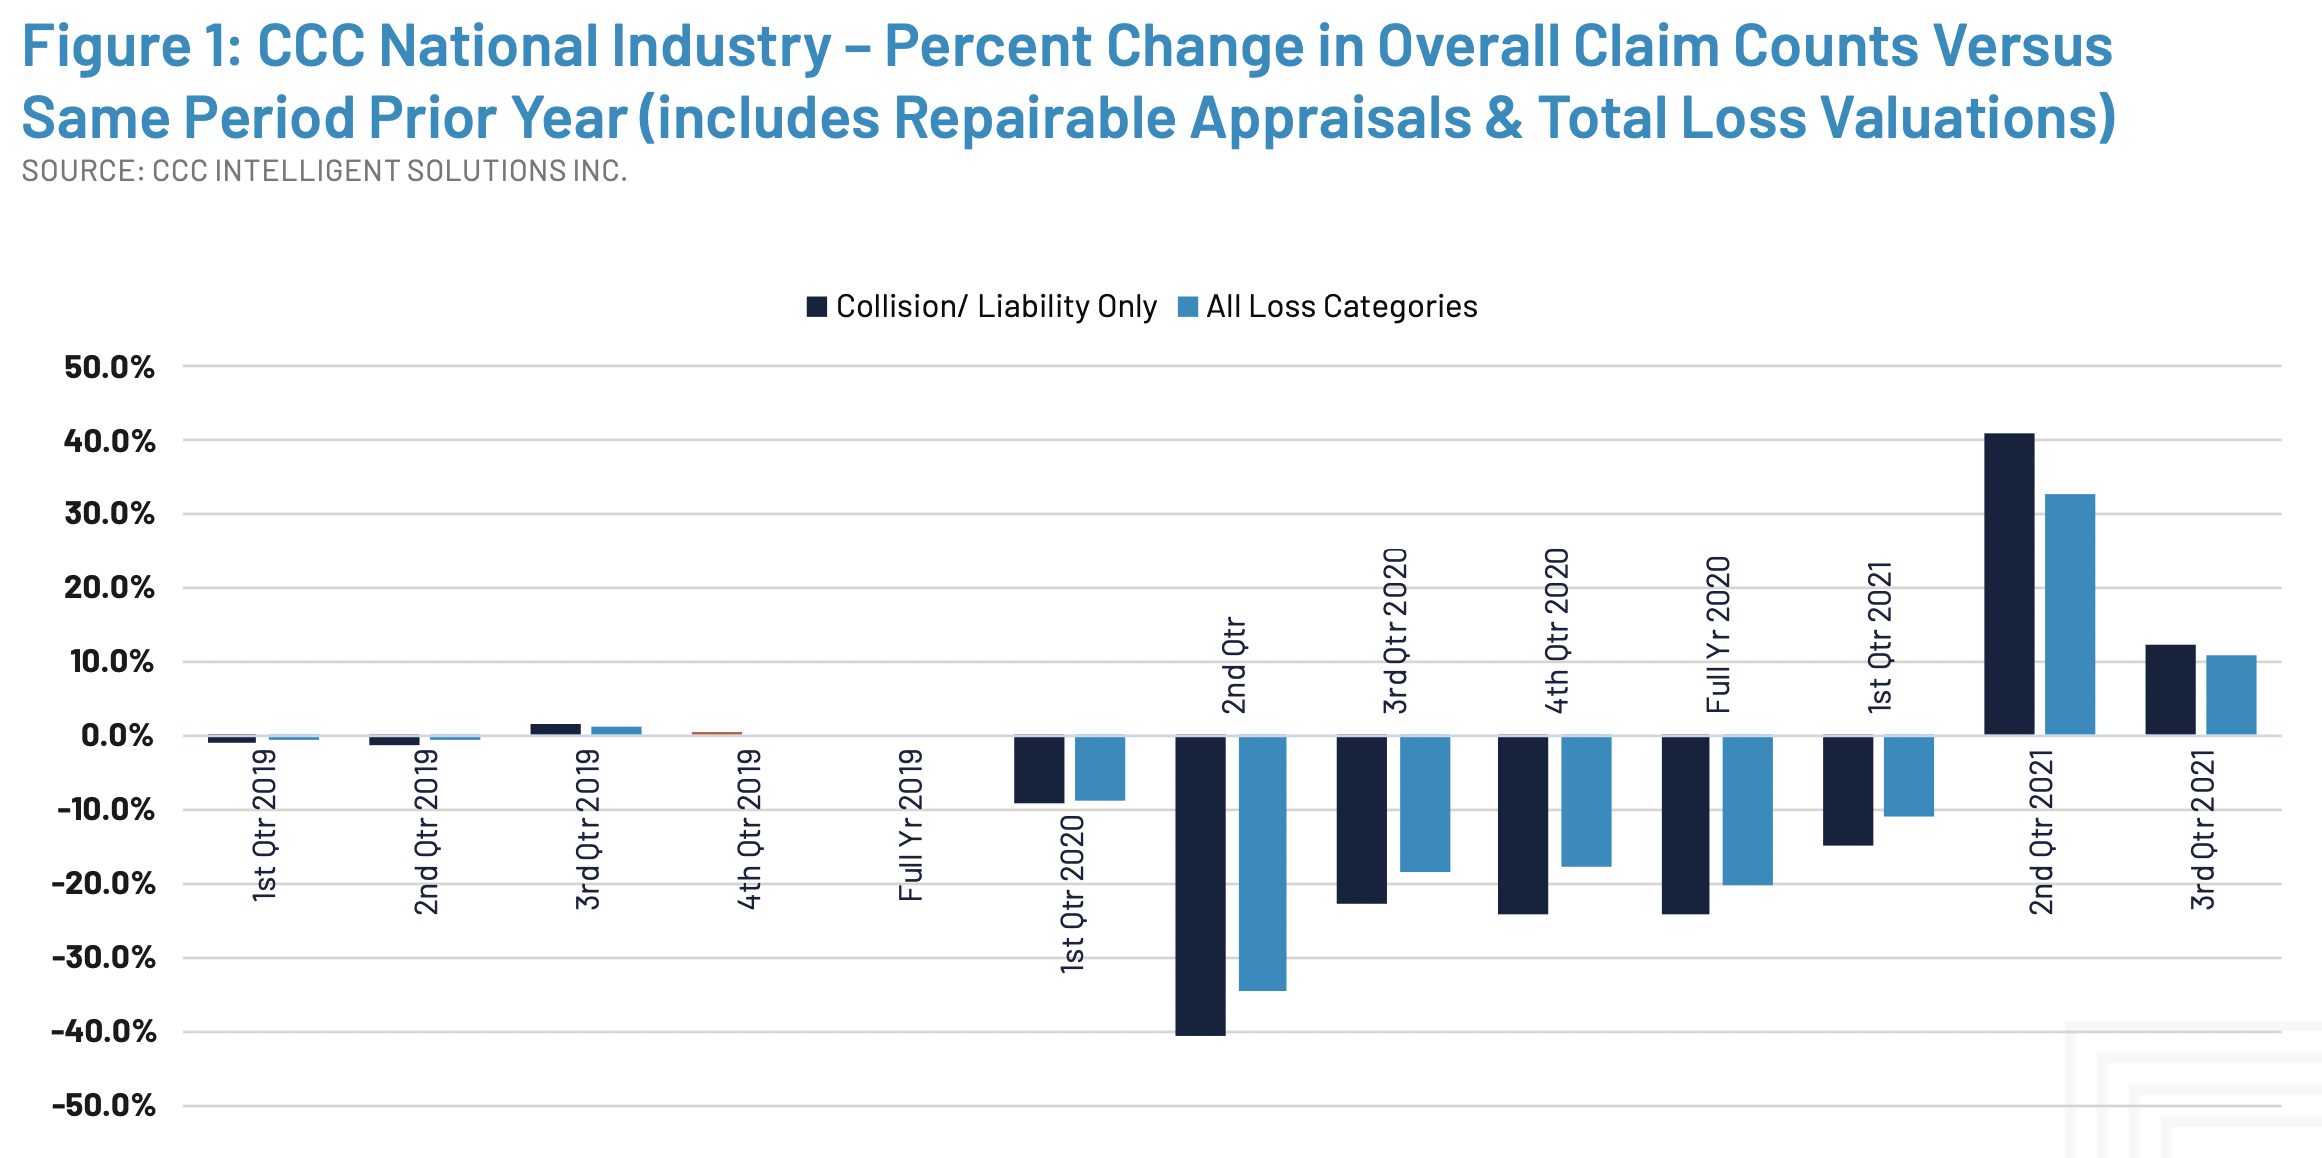
CCC and Enlyte agreed that the number of claims has risen, but is still below 2019 levels. CCC reported that the number of non-comprehensive claims is up 9 percent versus 2020, but still 15 percent below 2019 numbers. Enlyte said the number of “repairable claims” had risen a full 24.36 percent from 2020, but stands 2.3 percent below 2019 numbers.
CCC also took a look at the number of appraisals done. “In April of 2020, overall appraisal counts for collision and liability loss categories fell by over -50 percent versus April 2019. But while liability losses from May-December 2020 continued to see overall appraisal counts hover between -25 and -30 percent lower than the same period in CY 2019, monthly overall appraisal counts for collision losses experienced less of a decline.”
Enlyte predicted that, as business travel returns and more companies prepare their employees for a return to the office, “claims volumes will likely grow, potentially even exceeding pre-pandemic levels by the end of this year.”
Traffic patterns have shifted
With some 40 percent of U.S. workers now working remotely, and office occupancy rates hovering around 30-35 percent in 10 major cities, traffic patterns have changed, the CCC report says. “Telematics data suggests that historical rush hour patterns have changed and driving in different locations and at different times of day has grown,” it says. That’s significant, because traffic density, such as during rush hour, is directly related to crash rates.
CCC cited data from Arity showing that by the start of 2021, total miles driven had rebounded to exceed pre-pandemic levels by July 2021, and that mileage by time of day was up across the board throughout 2021. Leading that trend were mileage driving during weekday nights and weekday middays, both of which had historically been lower than morning and evening rush hour.
These changes have contributed to an overall increase in crash severity, CCC said. In a month-to-month comparison, the percentage of collision claims where the vehicle was non-drivable was higher in every case in 2021 than it had been in 2019 and 2020, according to CCC’s data.
The regions in which those drivers are racking up their miles are shifting, too, Enlyte reported — which it suggested might present new business opportunities for repairers. As more Americans work remotely, states with lower population density and overall taxes, such as Florida, Texas and Tennessee, are experiencing population growth, at the expense of states like Illinois, Chicago and New York, Enlyte said, citing census data.
Effects on repair costs
Collision vehicle repair costs are running well ahead of those for liability losses, CCC reported, although liability losses have seen a shift of losses into the higher repair cost brackets over the past five years.
“The rate of increase in both repair costs and total loss costs over the four quarters ending Q2 2021 however are some, if not the most significant increases we’ve seen, and are predominantly being driven by global supply chain disruptions and shortage of workers in many fields,” CCC said.
CCC found that parts sellers, who have been operating with smaller inventories, were unprepared for the rebound in the demand for parts, leading to backorders. Many parts that are available, it said, might be stuck overseas, thanks to bottlenecks at ports around the globe.
Thanks to those factors, and to the runup in prices for raw materials, the average cost per part has risen by more than 6 percent in 2021, the largest increase since 1997. Meanwhile, CCC blamed increasing complexity of vehicles for the increase in the average number of replacement parts needed per repair.
 Enlyte put the increase in the average repairable severity at 3 percent, based on Mitchell’s estimating data. “While some of the expense can be attributed to advancements in automotive technology and complexity, inflation may also be to blame—driving higher parts prices as a result of government spending, supply chain imbalances, an increase in the cost of raw materials and other factors,” Enlyte said.
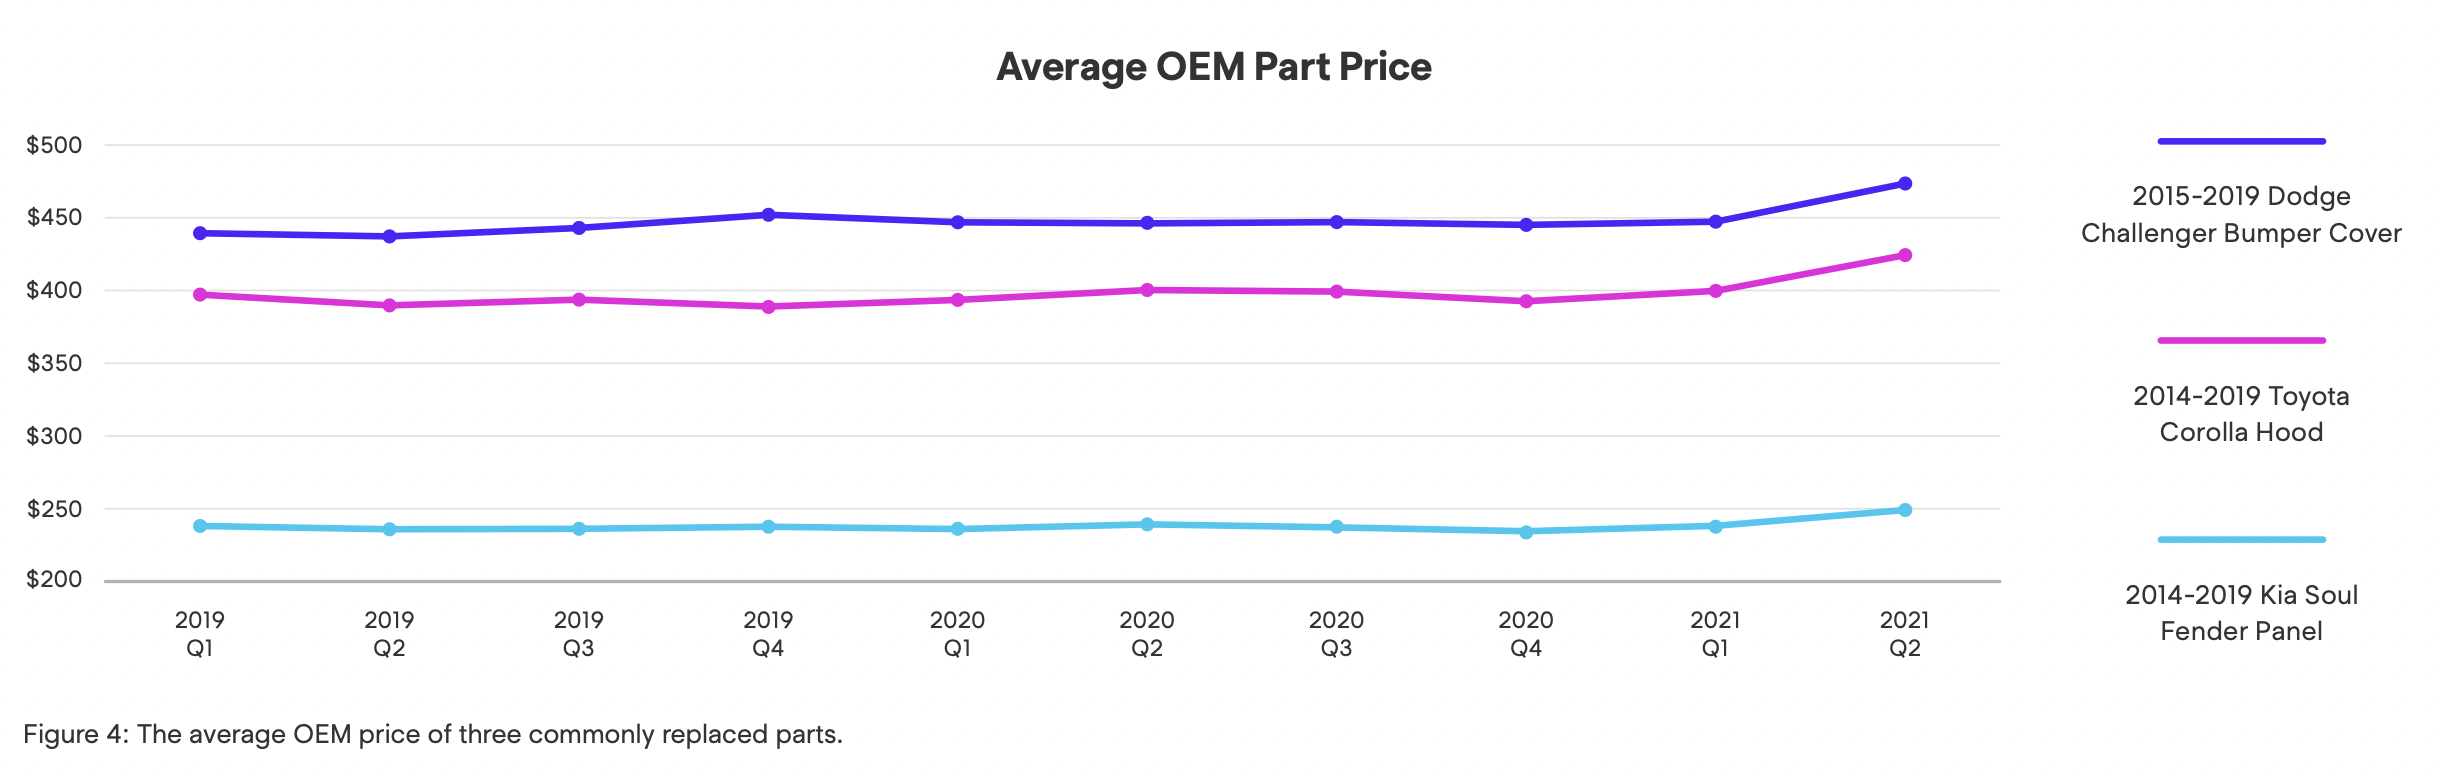
Mitchell’s data on the average price of OEM parts prices shows consistently rising prices for some of the most commonly replaced parts over the course of 2021, Enlyte said. For instance, prices for the 2014-2019 Toyota Corolla hood, 2015-2019 Dodge Challenger front bumper cover and 2014-2019 Kia Soul left fender have increased by 6.85 percent, 6.96 percent and 8.51 percent, respectively, between July 2019 and July 2021. Before 2021, prices had been relatively stable.
“If commodity prices continue to rise or even remain elevated, we may experience an additional increase in prices throughout the remainder of the year and into 2022,” Enlyte advised.
Total loss vehicle values rises
The effect of computer chip shortages on automobile production has been well documented. According to Cox Automotive, total sales in August 2021 were just 1,092,302, “among the lowest monthly total in a decade – and at the lowest volume since April 2020, when the global COVID pandemic initially shut down U.S. businesses.”
With this shortage, the average listing price for used vehicles has soared to record heights, CCC said. Prices in August were 24 percent higher than the same month in 2020, and 34 percent higher than 2019, CCC said.
This, in turn, has led to increases in total loss values, the report said. “Unfortunately, with the semiconductor chip shortage expected to continue into 2022, the industry may experience elevated total loss vehicle loss costs for some time,” CCC said.
More information
The Continued and Forecasted Impact of the Pandemic on the P&C Insurance Economy – CCC
Click to access 10-Oct-Trends.pdf
Enlytened: 2021 Trends Report
Click to access Enlytened-2021-Trends-Report.pdf
Images
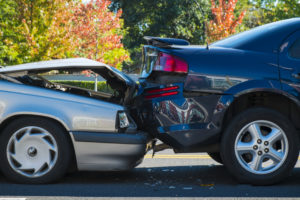
Featured image: An automobile crash on a city street. Changing traffic patterns are affecting the number and severity of crashes, analysts said. (RobertCrum/iStockphoto)
CCC director and lead analyst Susanna Gotsch was the author of CCC’s 2021 trends report. (Heather Eidson/Provided by CCC)
Ryan Mandell, the director of claims performance for Mitchell’s Auto Physical Damage division, wrote the auto insurance chapter of the Enlyte 2021 trends report. (Provided by Mitchell)
Graph showing percentage change in claim rates. (Provided by CCC)
A chart showing the average OEM price of three commonly replaced parts. (Provided by Enlyte)