
LOR reaches 17 day average, impacts policy limits and consumer satisfaction
By onAnnouncements | Collision Repair | Insurance | Market Trends
Historically high repair times have prompted many insurance carriers to consider adjusting the rental allocated days in their policies, Susanna Gotsch, the senior director and industry analyst for CCC Intelligent Solutions, told a CIECA webinar audience on Thursday.
During her 50-minute presentation, “2022 and the New Norm in the Collision Industry,” Gotsch said that, across the industry, CCC data shows that DRP repairs took more than 12 days on average in 2021, or two full days above 2020.
“Subsequently, we hear more carriers saying that their customers are experiencing issues when they run out of their rental allocated days based on their policies,” she said. “And many carriers have said that they’re looking at the number of days within their policies to determine whether those should be adjusted to help consumers.”
That’s especially true with rental policies that require the customer to pick up additional costs resulting from longer repair times, Gotsch said.
She told Repairer Driven News that the topic had come up with “a good number of carriers” during discussions on repair cycle times, but said the carriers provided no specifics.
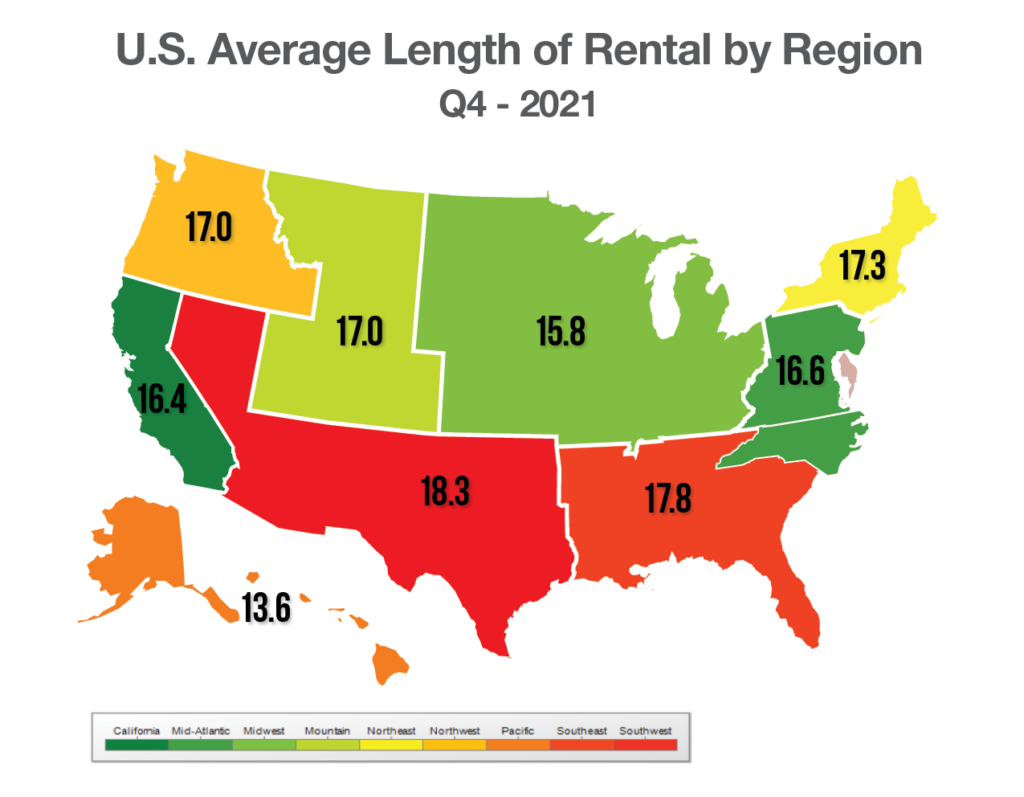
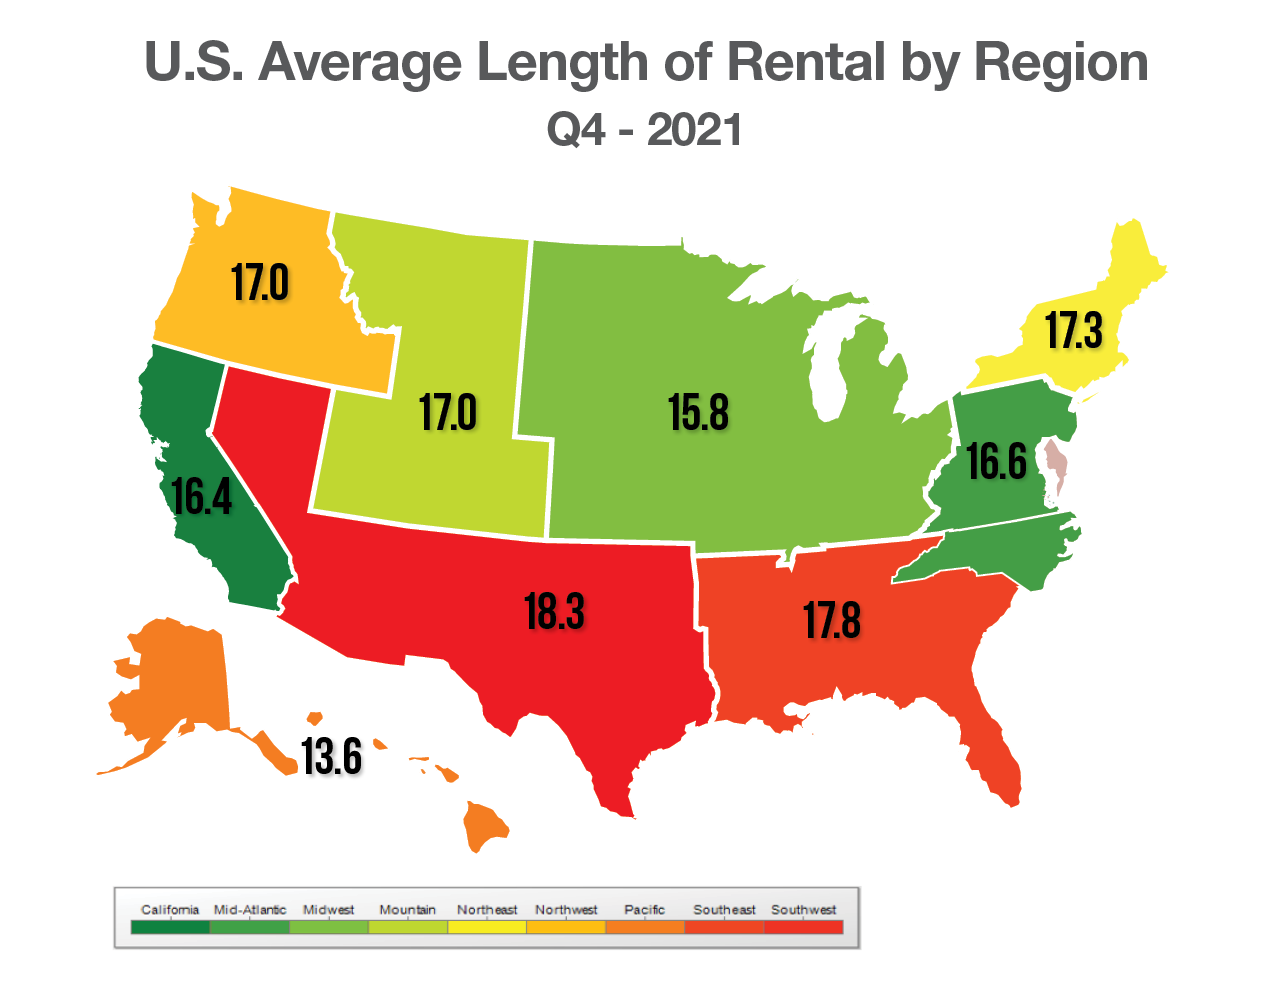
In its most recent quarterly length-of-rental (LOR) report, Enterprise Rent-A-Car said that overall LOR in the fourth quarter of 2021 reached 17.0 days, an increase of 1.8 days from the previous quarter, and 3.9 days from the same quarter of 2020.
Those numbers include replacement rentals for both drivable and non-drivable repairs, as well as total loss claims, Enterprise said.
 Effect on customer satisfaction
Another effect of longer repair times, and one that body shops might want to note, is the relationship between longer times and declining customer satisfaction, particularly in the higher price brackets.
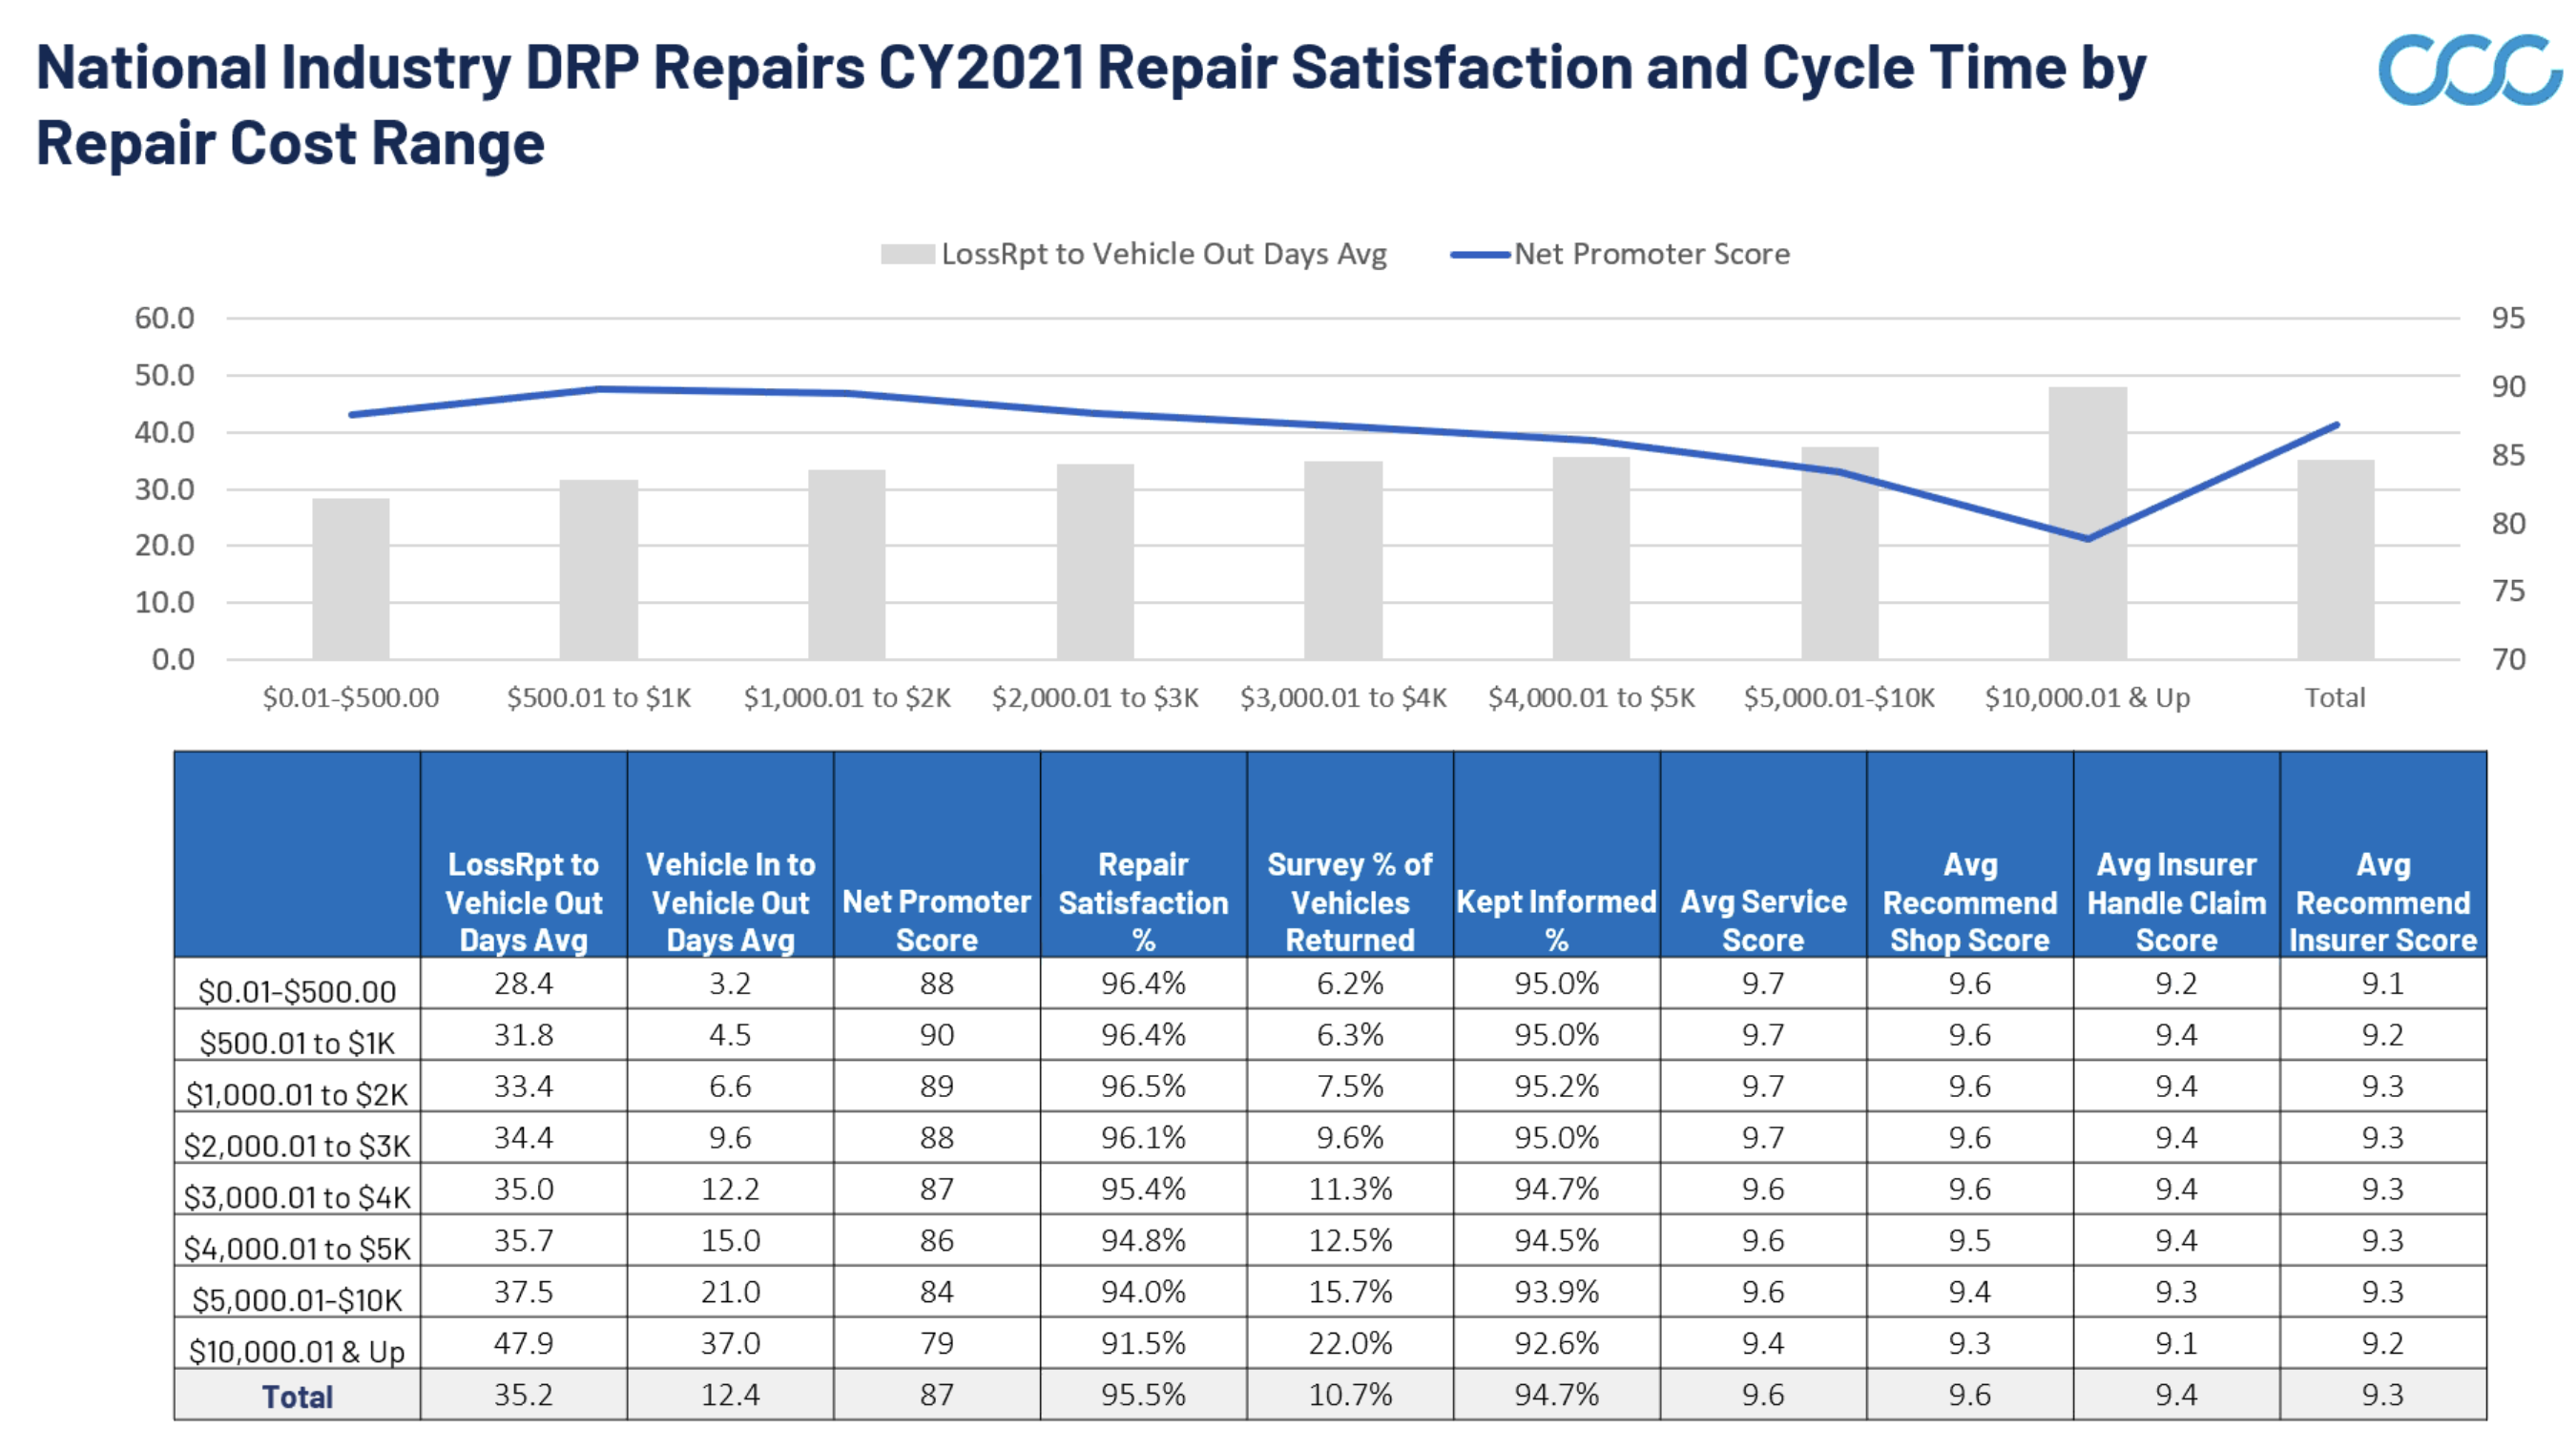
“We’ve seen repair times climb, but we’re also seeing more repairs shift into these higher dollar repair brackets where cycle times are longer. And by the time we get to a $10,000 repair or higher, the average repair time exceeds 35 days,” Gotsch said.
“You can see that for each $1,000 increment, we essentially see an additional two full days in the overall repair time, or the keys-to-keys time, that the vehicle is in the shop,” she said.
According to CCC’s data, customer satisfaction is highest for repairs of $500 to $1,000, at 96.4%, and drops steadily as the cost increases. For repairs of $10,000 or more, customer satisfaction stands at just 91.5%.
“Also worth noting is the percent of customers that indicate that they had to bring their vehicle back for additional work after they had picked it up also grows” as the cost of repairs increases, Gotsch said.
In the $3,000-$4,000 repair bracket, for instance, 11.3% of vehicles are returned to the shop to correct a problem. In the $10,000 and up bracket, that percentage jumps to 22.0%.
“And we also know if the customer has to bring their vehicle back there also there tends to have a pretty big hit on customer satisfaction,” Gotsch said.
She suggested that repairers could improve their customer satisfaction numbers by keeping their customers informed, noting that fewer customers in the higher cost bracket reported that the shop communicated well with them than in the lower cost brackets.
This gives shops an opportunity to help these customers “feel like they know what’s going on, and that they have full transparency into the repair process,” Gotsch said. “But certainly, as repairs continue to climb and the cost of repair continues to climb, the impact and understanding the impact to customer satisfaction cycle time and keeping customers informed is going to become ever more important.”
The drivers of cycle time
A number of factors are driving the increase in cycle time, Gotsch said. Among these are increased severity, a shortage of qualified technicians, lag time in the claims settlement process and supply chain issues.
The COVID pandemic had the effect of reducing the amount of traffic, both on city streets and on the interstates, she said. Although the total number of crashes has not risen to pre-pandemic levels, crashes on average are more severe.
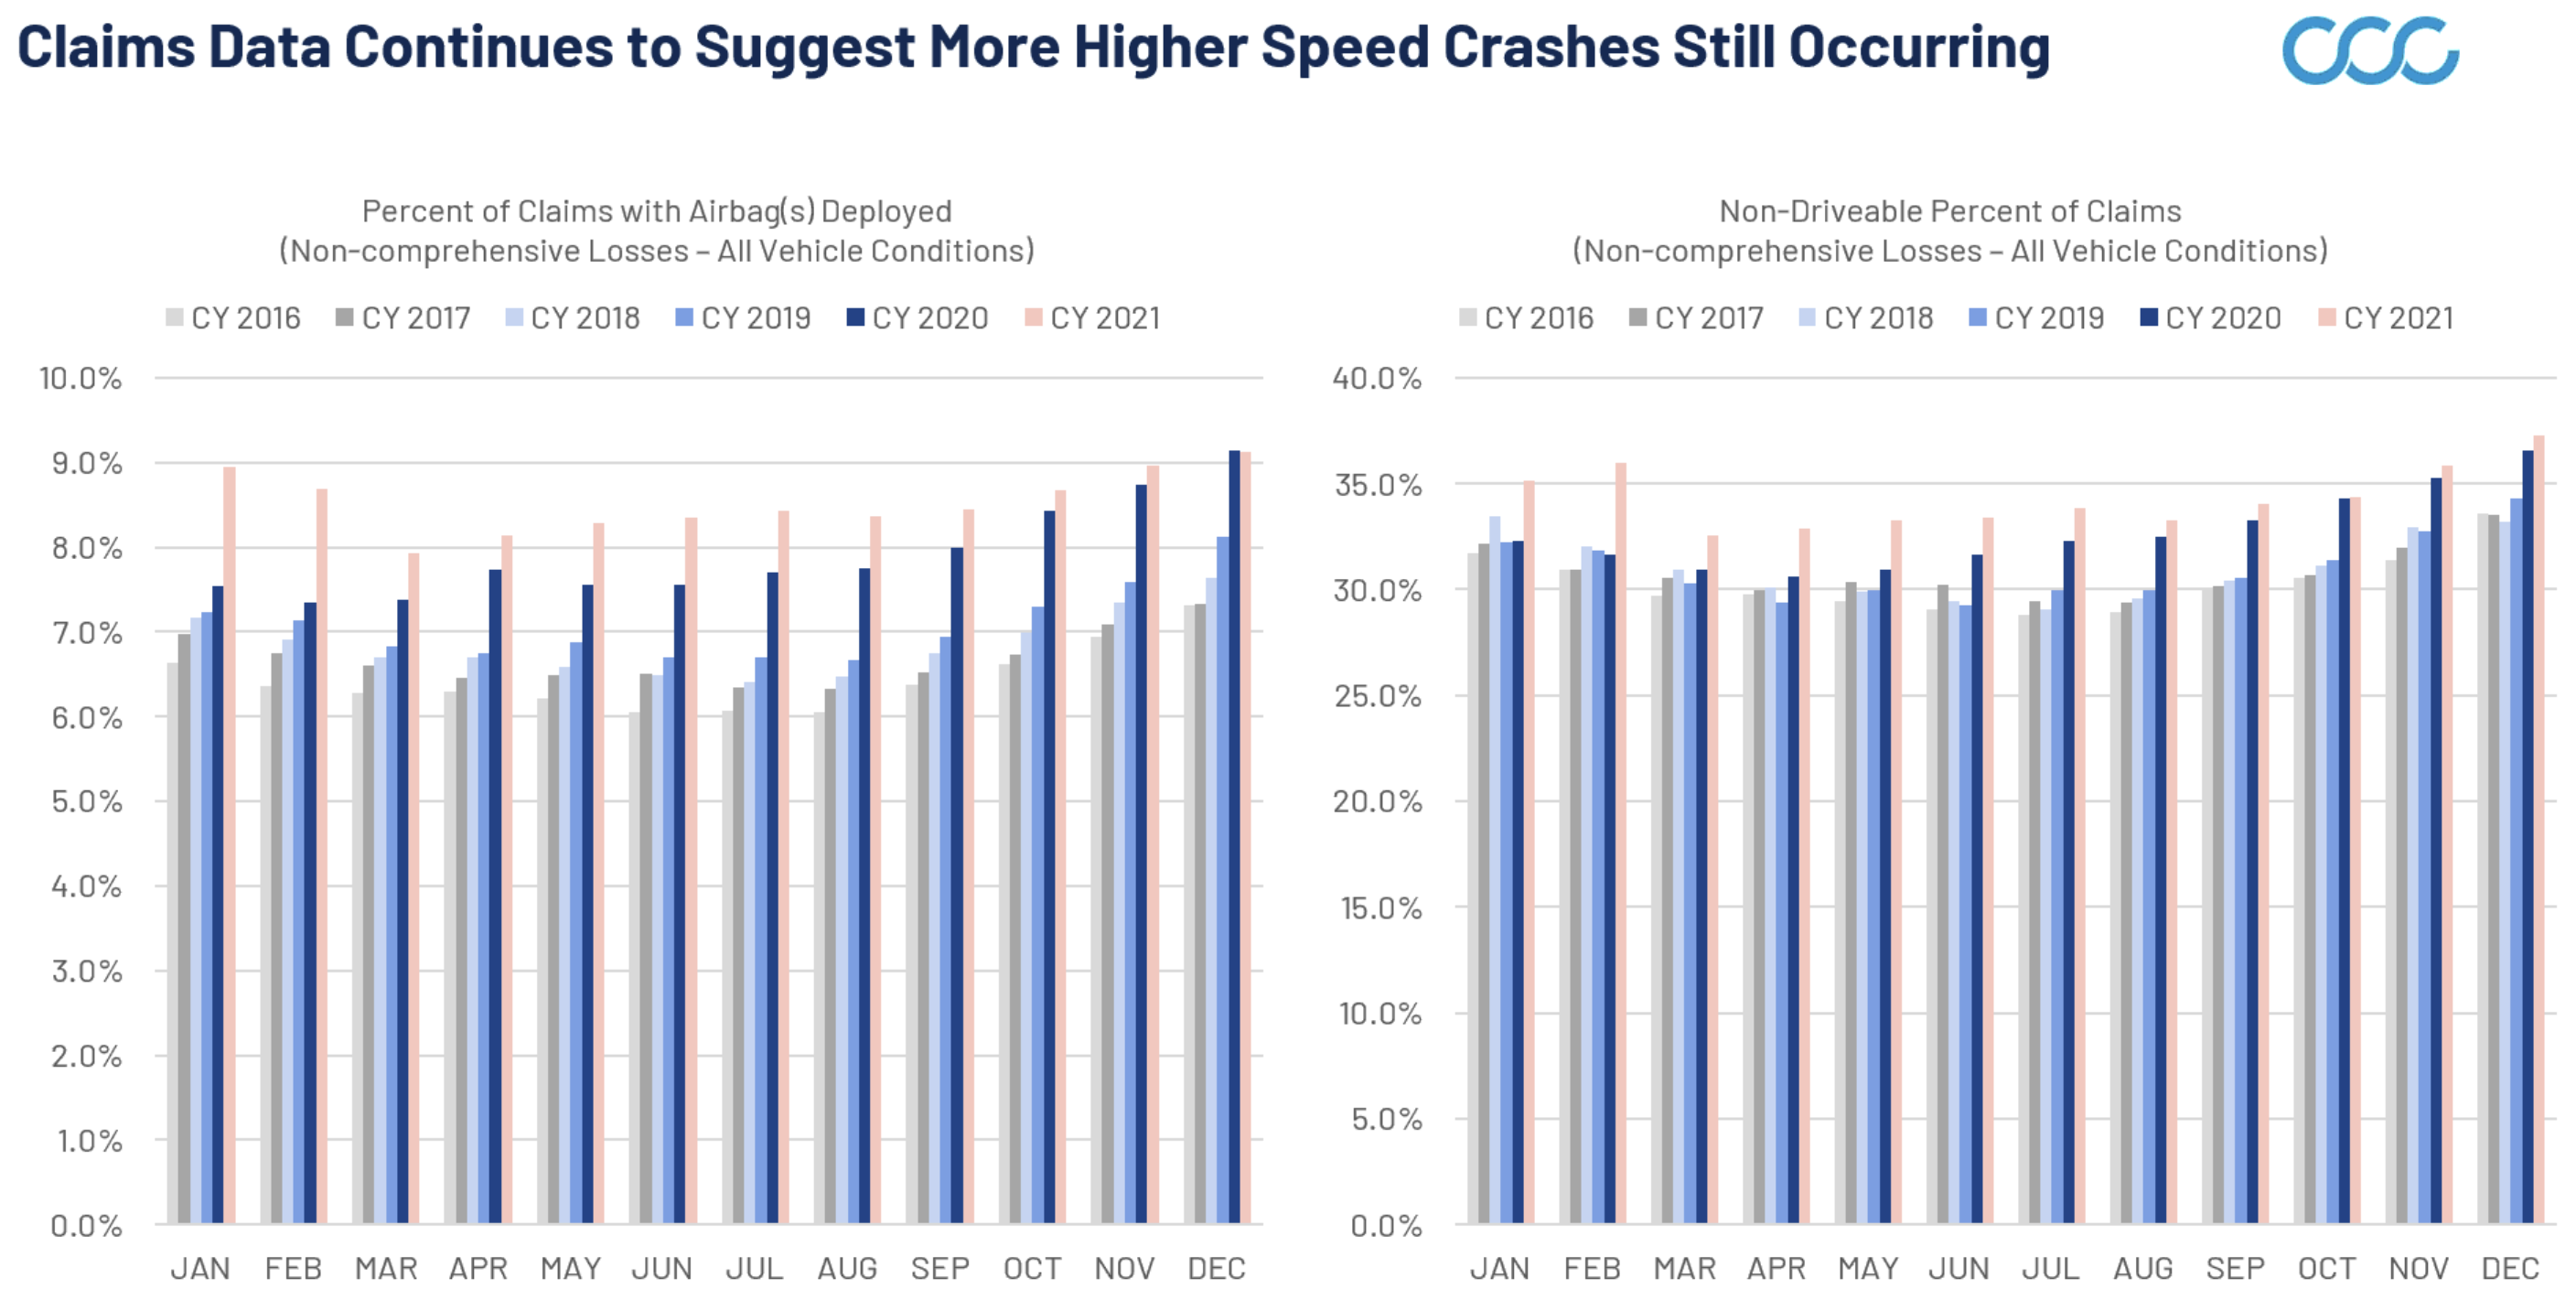
“The claims data shows we continue to see a change in the makeup of the claims characteristics as a byproduct of some of that reduced congestion, specifically, more non-drivable claims and more claims flagged as total loss,” she said.
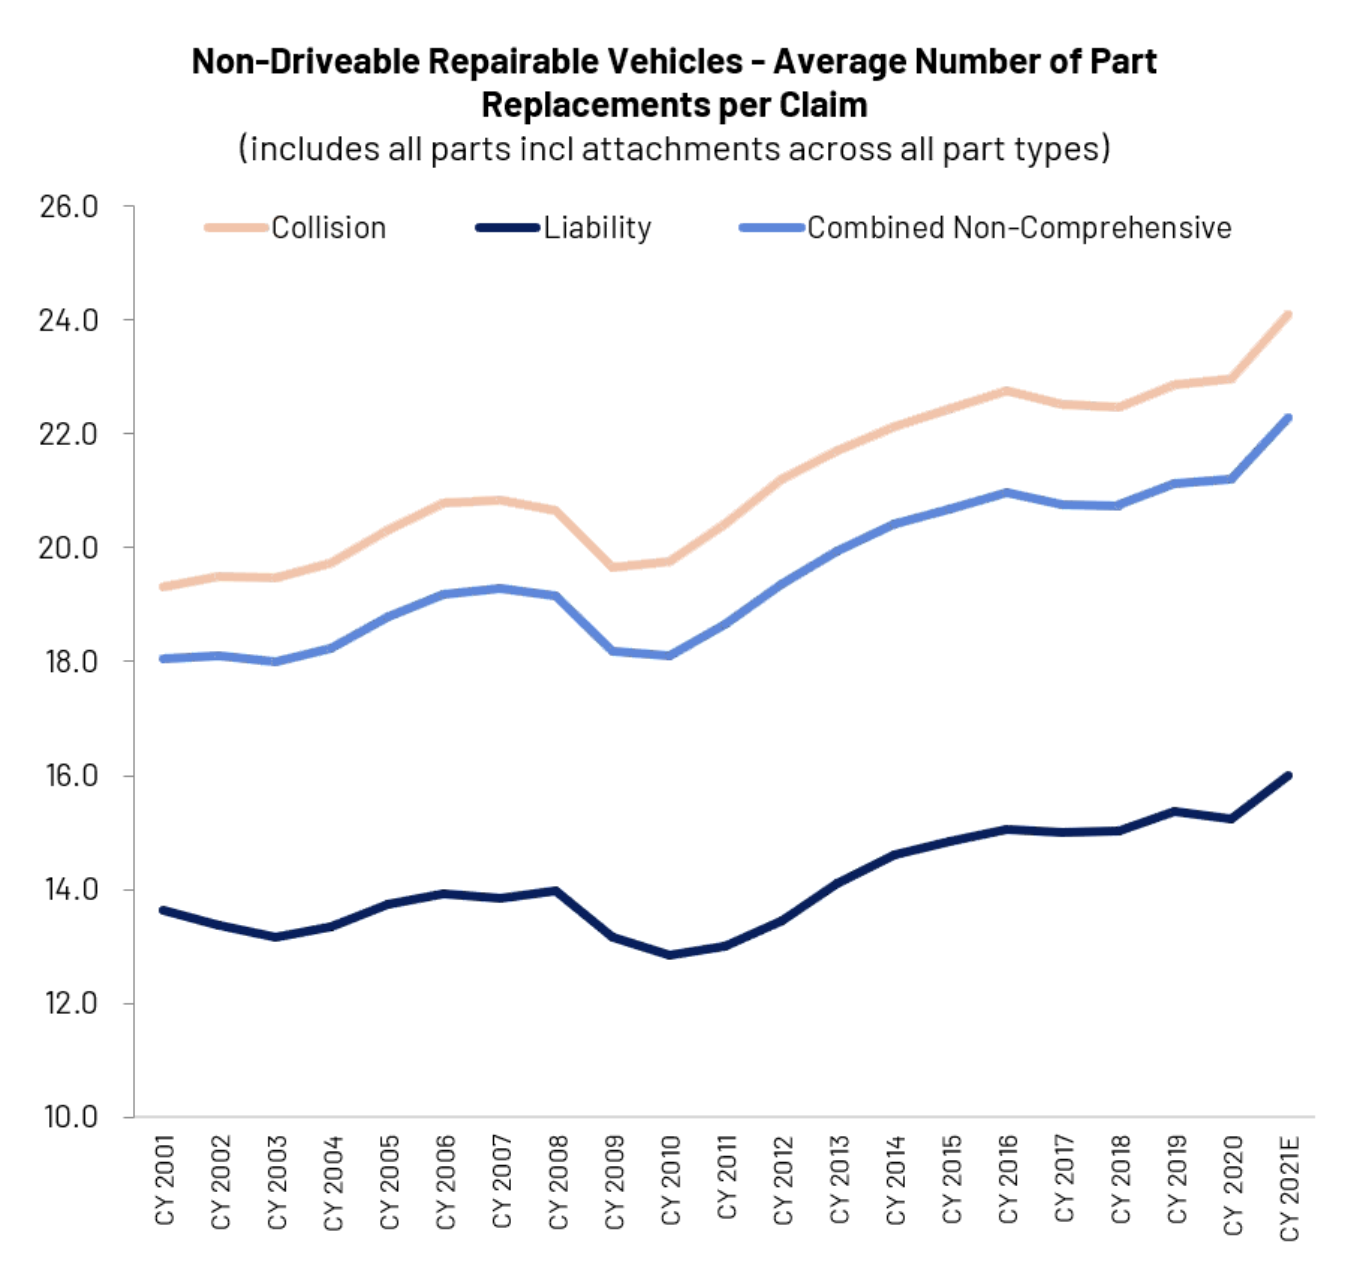
This translates into more complex repairs that require more money and time. “The average collision loss as of 2021 required, on average, about 10 part replacements; the average non-drivable collision loss required well over 24 parts. So as you shift towards more non-drivable, you’re going to have a higher cost repair, more complexity, more parts needing replacement, etc.”
 “When you have more non-drivable vehicles, more of the repairs take more time. They require more part replacements and shift into some of these higher dollar brackets. And when you have a higher cost repair you also have longer cycle times.”
Increased vehicle complexity plays a role, too, she said. Cars are becoming more complex, with added sensors for both convenience items like rain-sensing wipers and for advanced driver assistance systems, and “all of those things have added to the complexity of the repair and the number of parts requiring replacement when that vehicle is damaged.”
At the same time, shops are grappling with a shortage of qualified technicians, Gotsch said, a fact reflected in falling productivity rates.
“The labor hours per repair day for both drivable repairs and non-drivable repairs has fallen. Again, a lot of this when we talk to repairers has to do with shortage of technicians, qualified technicians, having to balance COVID restrictions, having to balance employees being out with COVID” and quarantined, she said. “All of these have had a pretty significant hit on overall productivity.”
This trend is likely to continue in the short term, “with many repairers seeing repair volumes grow but still unable to find the technicians to help complete the work. We expect that we’ll continue to see labor hours per repair day remain below where it was before the pandemic.”
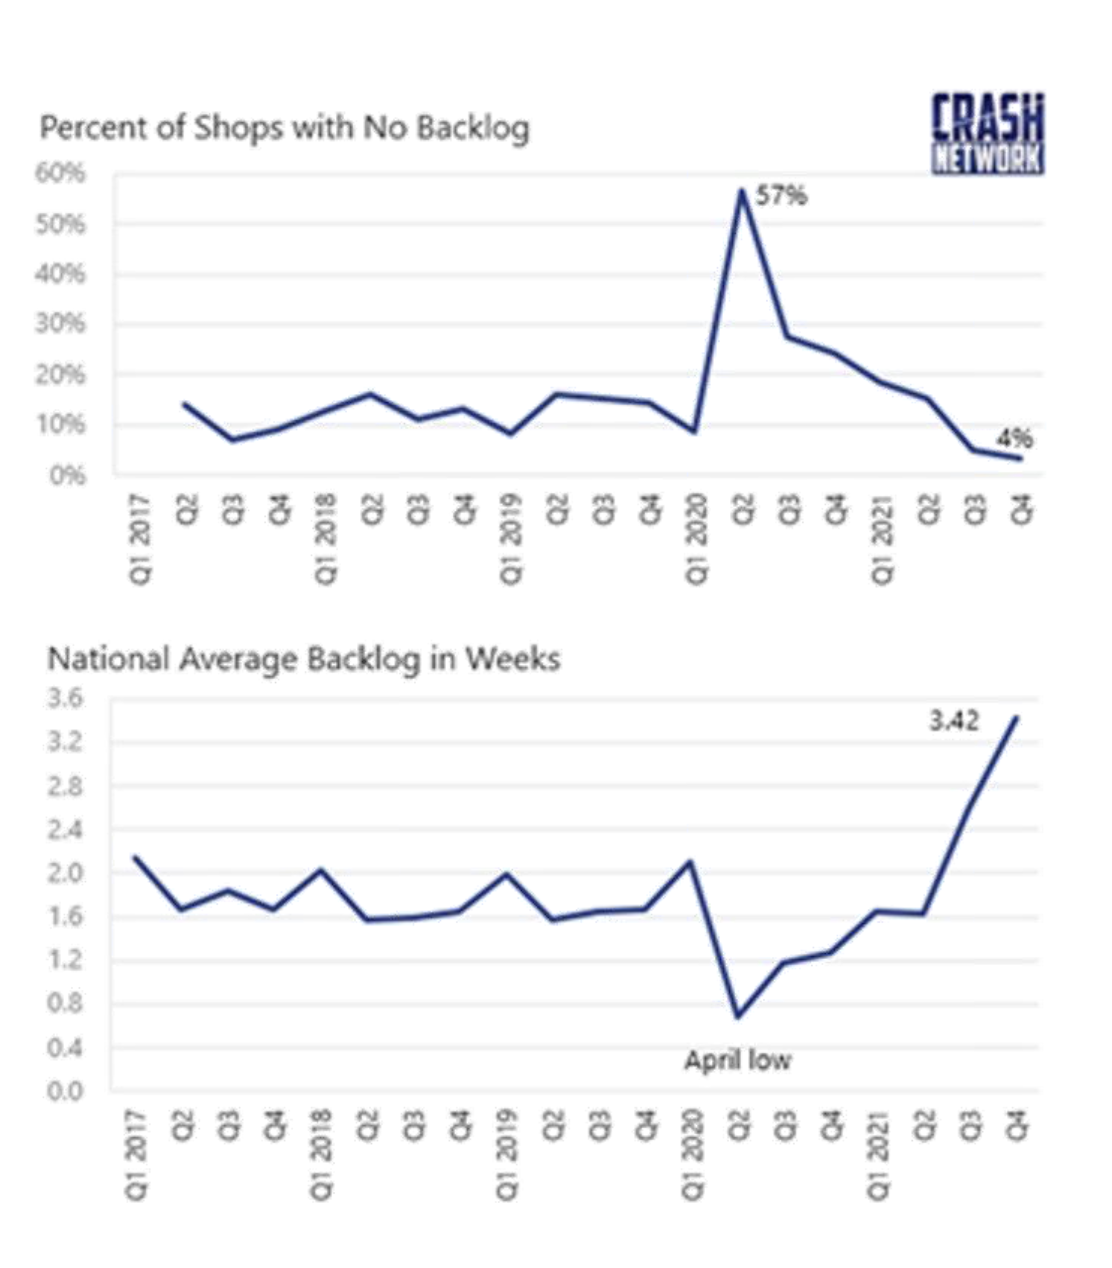 According to data from the CRASH network, just 4% of shops report having no backlog. In the fourth quarter of 2021, Grosch said, the national average backlog jumped to 3.42 weeks, twice the length of a typical fourth quarter and almost two full weeks longer than pre-pandemic. She said 67% of shops are now scheduling work out two or more weeks.
Aside from parts availability and a shortage of technicians, a key issue contributing to the backlog was “getting responses from insurers, either getting an appraiser out to the shop to write the appraisal, to approve supplements or to review re-inspection results.”
Insurers, too, are struggling to hire staff to meet the rising demand as claim counts begin to recover coming out of the pandemic, she said.
More information
Recent CIECAST webinars:
https://www.cieca.com/ciecast-webinars#recent
Images
Featured image: Susanna Gotsch. (Provided by CCC Intelligent Solutions)
“U.S. Length of Average Rental By Region Q4” provided by Enterprise Rent-A-Car
“National Industry DRP Repairs CY2021 Repair Satisfaction and Cycle Time by Repair Cost Range,” “Claims Data Continues to Suggest More Higher Speed Crashes Still Occurring” and “Non-Driveable Repairable Vehicles — Average Number of Part Replacements Per Claim” provided by CCC Intelligent Solutions
“Percent of Shops with No Backlog” provided by CRASH Network