Average length of rental up by nearly one-third since 2020, Enterprise reports
By onAnnouncements | Collision Repair | Market Trends
Average length of rental (LOR) for collision replacement-related rentals stretched to 18.2 days in the third quarter of 2022, representing a three-day increase from the same period last year and a rise of nearly six full days over the past 24 months, Enterprise reported Friday.
Rentals associated with non-drivable repairs jumped 5.3 days year-over-year, while rentals for drivable repairs were up 2.6 days, Enterprise said in its quarterly U.S. Length of Rental report.
The results “continue to be exacerbated by supply chain disruptions, parts delays, collision repair backlogs, claims process challenges and technician shortages,” Enterprise said.
The phrase “claims process challenges” is a reference to delays driven by virtual claims processing, Enterprise told Repairer Driven News.
“As traditional claims processes – such as in-person interactions between insurers and repairers – have shifted to more virtual methods, delays in reconciliations on estimates and supplements can impact the overall cycle time, and therefore length of rental,” a company spokesperson said.
Enterprise said the results are in line with seasonal norms it had predicted in the second quarter, just with higher overall totals. The half-day increase from Q2 to Q3 is in line with historical results, it said. For instance, results rose by two full days between the second and third quarters of 2021.
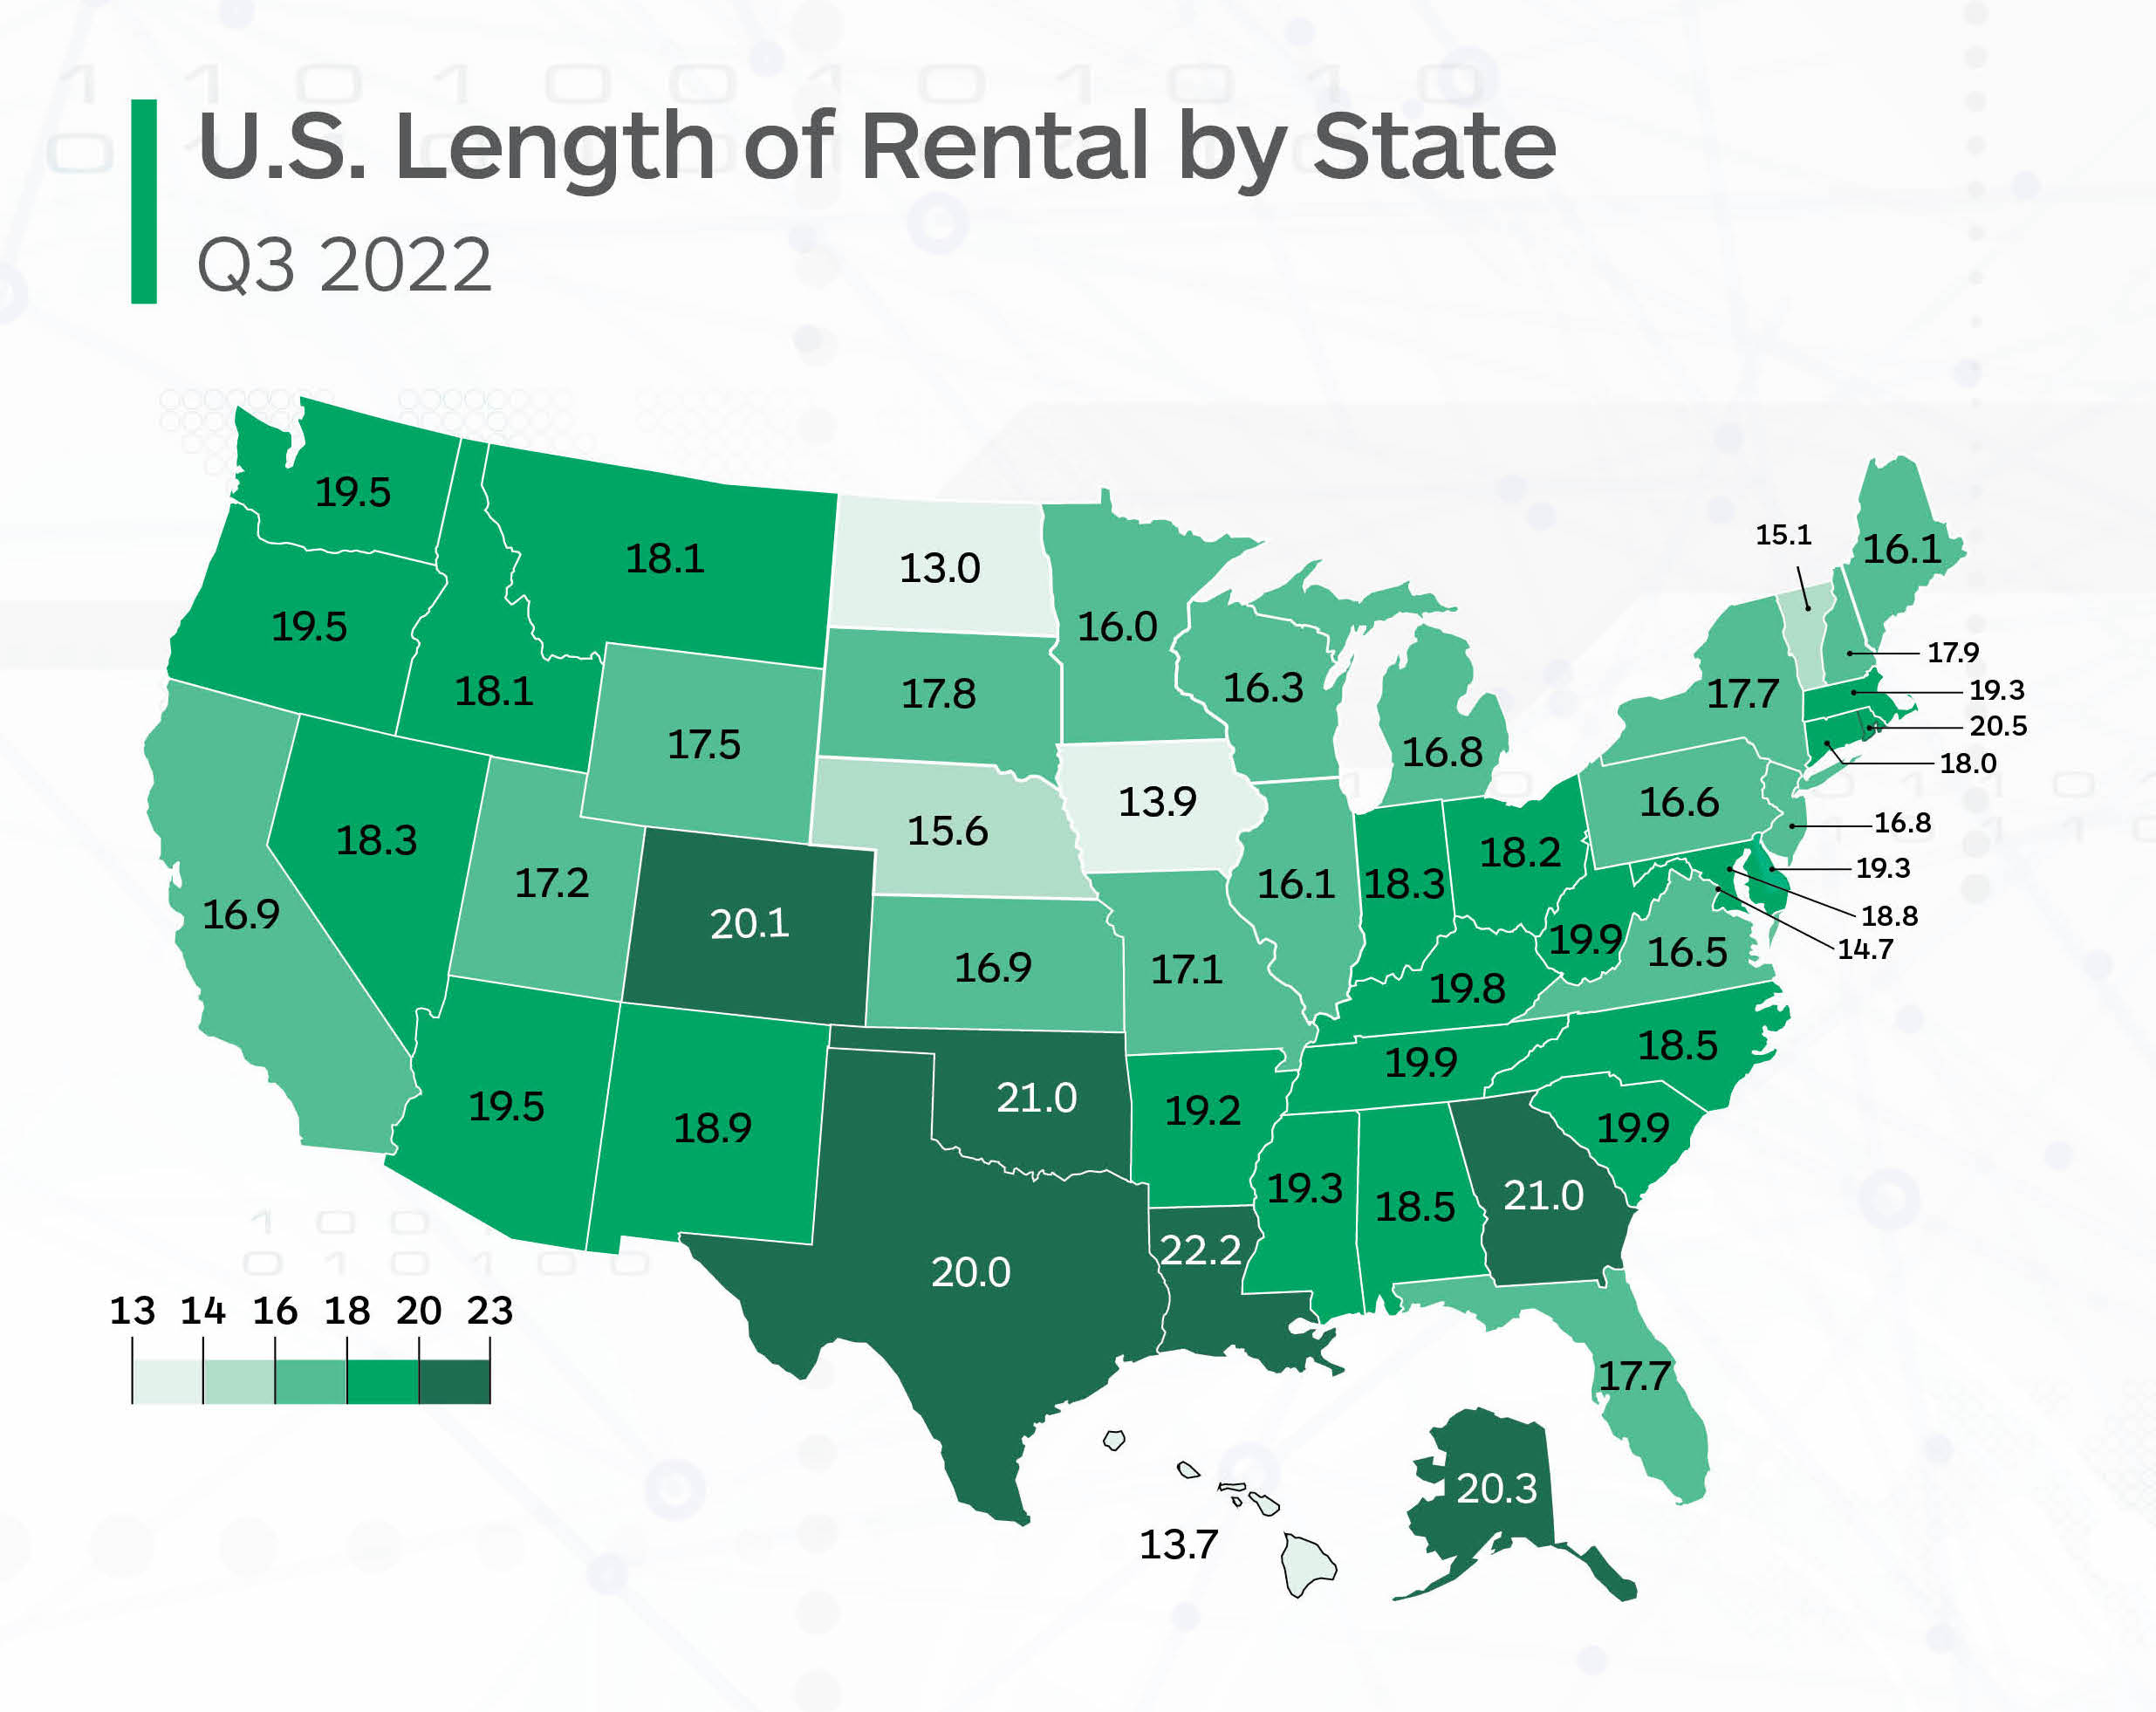
By state, Louisiana recorded the highest overall LOR at 22.2 days, a 3.5-day increase from Q3 2021, the report said. Georgia and Oklahoma were both at 21 days, a 3.9- and 3.5-day increase, respectively. Rhode Island, Alaska, Colorado, and Texas all had results greater than 20 days. Eleven other states were greater than 19 days.
LOR was lowest in North Dakota, at 13.0 days, a 1.3-day increase from Q3 2021. It was followed by Hawaii (13.7 days), Iowa (13.9 days), Washington, D.C. (14.7 days), and Vermont (15.1 days).
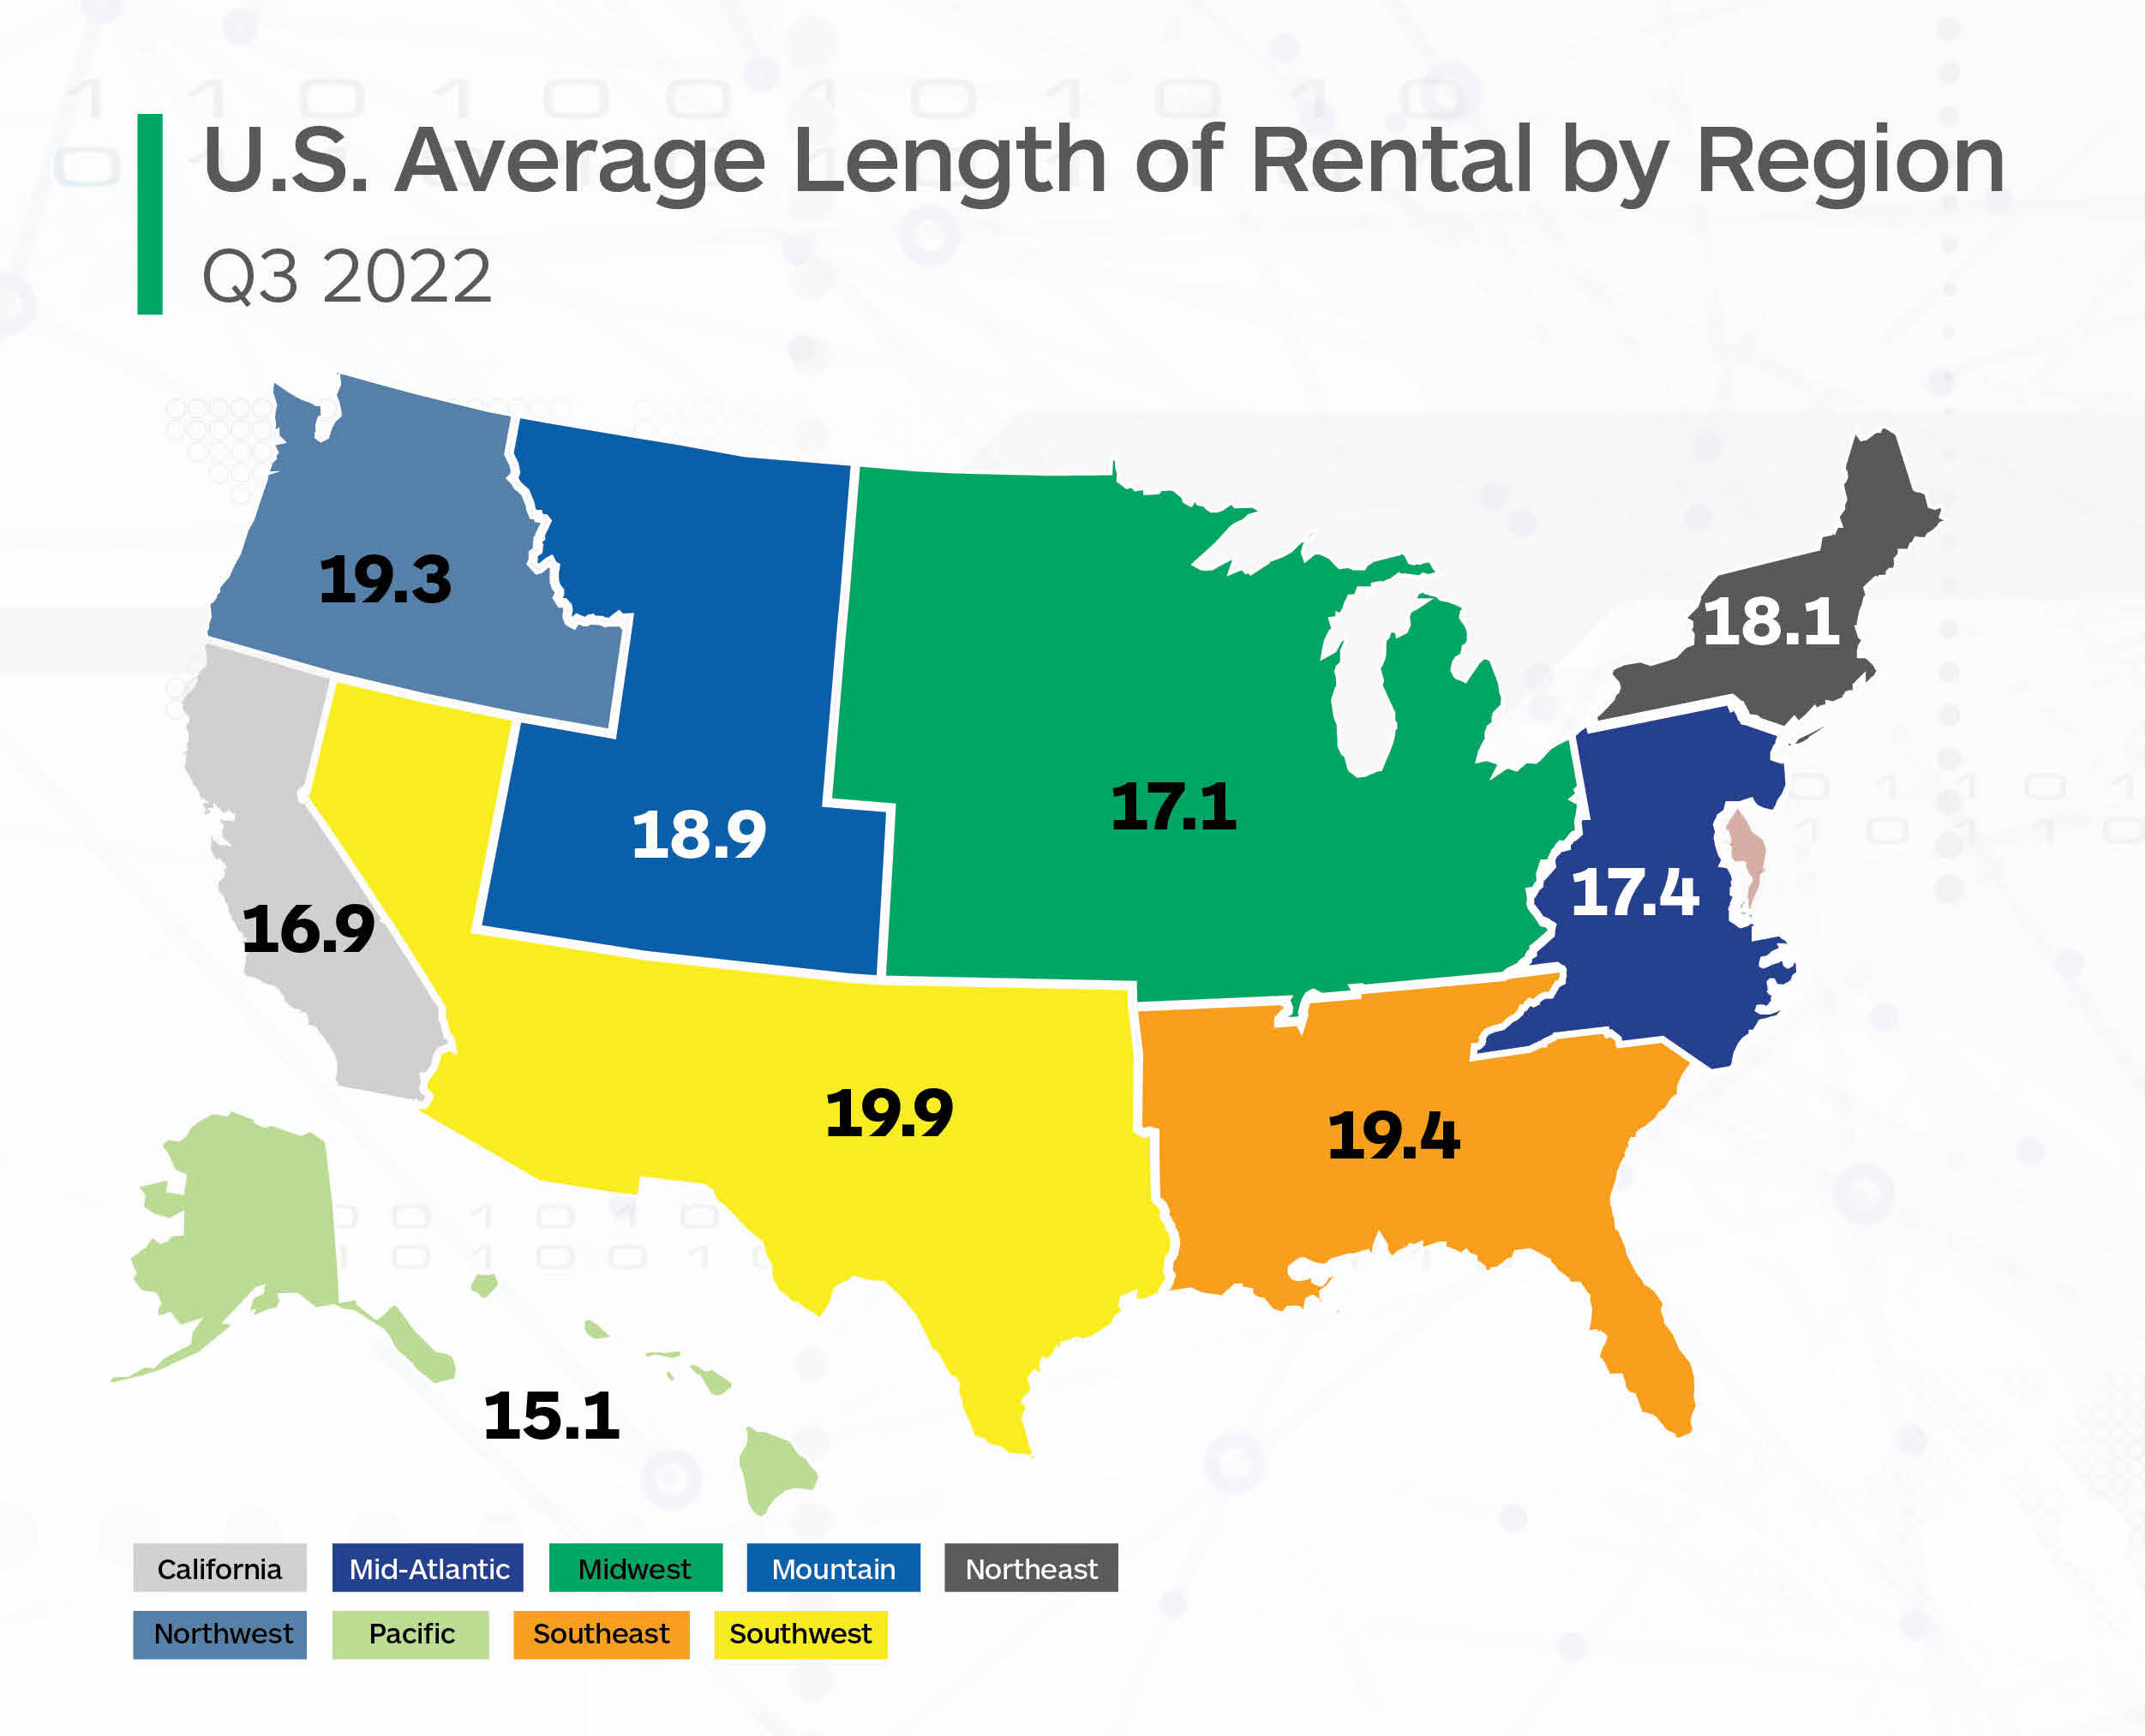
Regionally, LOR ranged from a low of 15.1 days in the Pacific states of Alaska and Hawaii to a high of 19.9 days in the Southwest. The Southwest, Southeast, Northwest, and Mountain states were all above the national average, while the Northeast, Mid-Atlantic, Midwest, California, and Pacific were all below. The greatest year-over-year jump was 4.4 days, in the Northwest.
Drivable vs. non-drivable
For rentals associated with a drivable repair, average LOR was 15.7 days — a 2.6-day increase from Q3 2021, Enterprise said. Louisiana had the highest drivable LOR at 18.6 days, followed by Oklahoma (18.4), Georgia (18.4), and Rhode Island (18.0). Washington (16.5) had the largest drivable LOR increase, up four days, while Colorado (17.1) and Arkansas (16.7) were both up 3.8 days over Q3 2021.
North Dakota had the lowest LOR for drivable claims at 9.9 days, a 0.4-day increase from Q3 2021. The next lowest result was Hawaii at 11.2 days, up 0.5 days, and Iowa at 11.5, up 1.4 days.
Non-drivable rental LOR was 27.2 days, a 5.3-day increase from Q3 2021. Twelve states had non- drivable LORs greater than 30 days, Enterprise said, led by Louisiana (34.3), Alaska (34.2), Colorado (32.2), and Oklahoma (32.0). The largest year-over-year increase, 10.3 days, was seen in Washington, where the average LOR was 31.9 days. Thirty-four states plus Washington, D.C., saw increases greater than five full days from Q3 2021, Enterprise said.
LOR for rentals associated with a total loss claim was 17.8 days, a 1.6-day increase from Q3 2021. Hawaii had both the highest total loss LOR and the greatest increase, up by 7.3 days to 23.2 days. On the other end of the scale, Washington, D.C. saw a 2.4-day decrease, and Alabama a 1.1-day decrease.
Trucks and SUVs, which take an average of 0.7 days longer to repair than passenger cars, were a growing part of the repairable claims volume in Q3 2022, Ryan Mandell, Director of Claims Performance for Mitchell International, told Enterprise. He said trucks and SUVs represented 57.07% of repairable claims, up from 57.02% in 2022 and 52.46% in 2021.
Frequency also continued to increase for luxury vehicles, which take 2.9 days longer than common-make vehicles to repair, Mandell said. He said 12.9% of repairable vehicles in Q3 2022 were classified as luxury vehicles, versus 12.84% for the same period in 2021, and 10.53% in 2020.
“Overall repairable volume declined by 1.8% in Q3 2022 compared to Q2 2022 but grew by 6.8% compared to Q3 2021,” Mandell told Enterprise. “The increase in repairable volume over Q3 2021 is not only being driven by growth in miles traveled but also by the lower relative frequency of total loss outcomes due to higher vehicle ACVs. Total Loss frequency stands at 14.5% in Q3 2022, up only slightly from 14.4% in Q2 2022 but down significantly from 17.1% in Q3 2021.”
Record backlogs
Shops’ backlogs are at a record high, according to John Yoswick, editor of the weekly CRASH Network newsletter. “After easing a bit in the second quarter, the backlog of scheduled work at shops nationwide rose to an average of 4.8 weeks in July, up from 4.3 weeks in the second quarter, and a new record high. Nearly one in five shops (18.5%) are scheduling more than eight weeks out, a percentage that, until this past year, had never exceeded 2%.”
He said the high number of shops scheduling work more than eight weeks out might be understating the current condition, because “more than eight weeks” is the longest response available in CRASH Network’s survey.
The backlogs have an outsized impact on non-drivable repairs, Yoswick said, with jobs stalled by the lack of parts or other delays. Among 350 shops that responded to CRASH Network’s “Business Perspectives” survey in September, he said, the average shop repairs 80 cars per month and currently has 51 jobs in process, or 64% of their typical monthly volume. “Although that is only slightly higher than the average 62% work-in-progress the same survey found in June, it signals that most shops continue to be loaded up with work waiting to be completed.”
Nine in 10 shops have 24% or more of their monthly volume in progress, while one in four has 80% or more of its monthly volume in process, and one in 10 is approaching 120%, Yoswick told Enterprise.
Technician shortages
Two-thirds of shops are currently searching for at least one body technician, an increase of 5 percentage points from three years ago, while 38% of shops are looking to hire a body helper, up 7 percentage points from both a year ago and three years ago, Enterprise said, citing data from Yoswick.
Yoswick reported that a CRASH Network survey in June found that 85% of shops are looking to fill at least one position in their facility, up from 79% a year ago.
Parts availability
Greg Horn, Chief Innovation Officer at PartsTrader, told Enterprise that aftermarket parts availability, as measured in the number of quotes per part, was in line with previous quarters. “However, the median plus two standard deviations delivery days in July and August for aftermarket parts did spike up to over 3.5 days, the highest median this year,” Horn said.
Delivery day measures for OEM parts showed the same spike, which exceeded 15 days for the quarter, he said. “This corroborates the longer non-drive rental days, as non-drives will have more OEM parts per repair and therefore more opportunity for long parts delays.” Imported makes had the longest delivery days, Horn said, with some showing median plus two standard days at over 20 days for the quarter.
Longer repair cycle times are not simply parts-related , Horn told Enterprise. “Car makers are continuing to see long-term parts availability issues, whether it’s packing materials to box the finished parts, production line staffing issues or ship and rail delays. There is no quick fix on the horizon.”
As vehicles continue to become more complex to repair, “the entire industry must play a part in ensuring all collision-related businesses are aligned – not just for procedural solutions, but to ensure our mutual customers receive safe and proper repairs, and excellent experience and peace of mind,” the report said.
Images
Featured image: An Enterprise Rent-A-Car facility. (WestportWiki/CC BY-SA https://creativecommons.org/licenses/by-sa/3.0)
Graphics provided by Enterprise Rent-A-Car