
LOR sees first year-over-year decrease since 2020 following Q1 record high
By onCollision Repair | Insurance
Enterprise reports that length of rental (LOR) reached 17.4 days during Q2 which, for the first time since the onset of the COVID-19 pandemic, is a year-over-year (YoY) decrease; down from 17.7 days last year.
LOR for Q2 2021 was 13.2 days. The one-and-a-half day decrease from Q1 to Q2 of this year is largely due to an uptick in parts delivery times and improvement in shop prioritization of repairs that require readily-available parts rather than backlogged parts. The 18.7-day LOR from Q1 was a record high.
“States that saw increases in overall LOR in Enterprise’s data, such as Arkansas, Florida, Georgia, and Minnesota, also saw similar trends when comparing parts delivery days,” said PartsTrader Chief Innovation Officer Greg Horn.
“Parts delays are still a significant factor in repair time and length of rental, and shops are making a great effort to schedule repairs for drivable vehicles to maximize shop throughput.”
Alaska recorded the highest overall LOR in Q2 at 22.7 days, followed by Georgia (20.5), Colorado (20.2), and Louisiana (20.1).
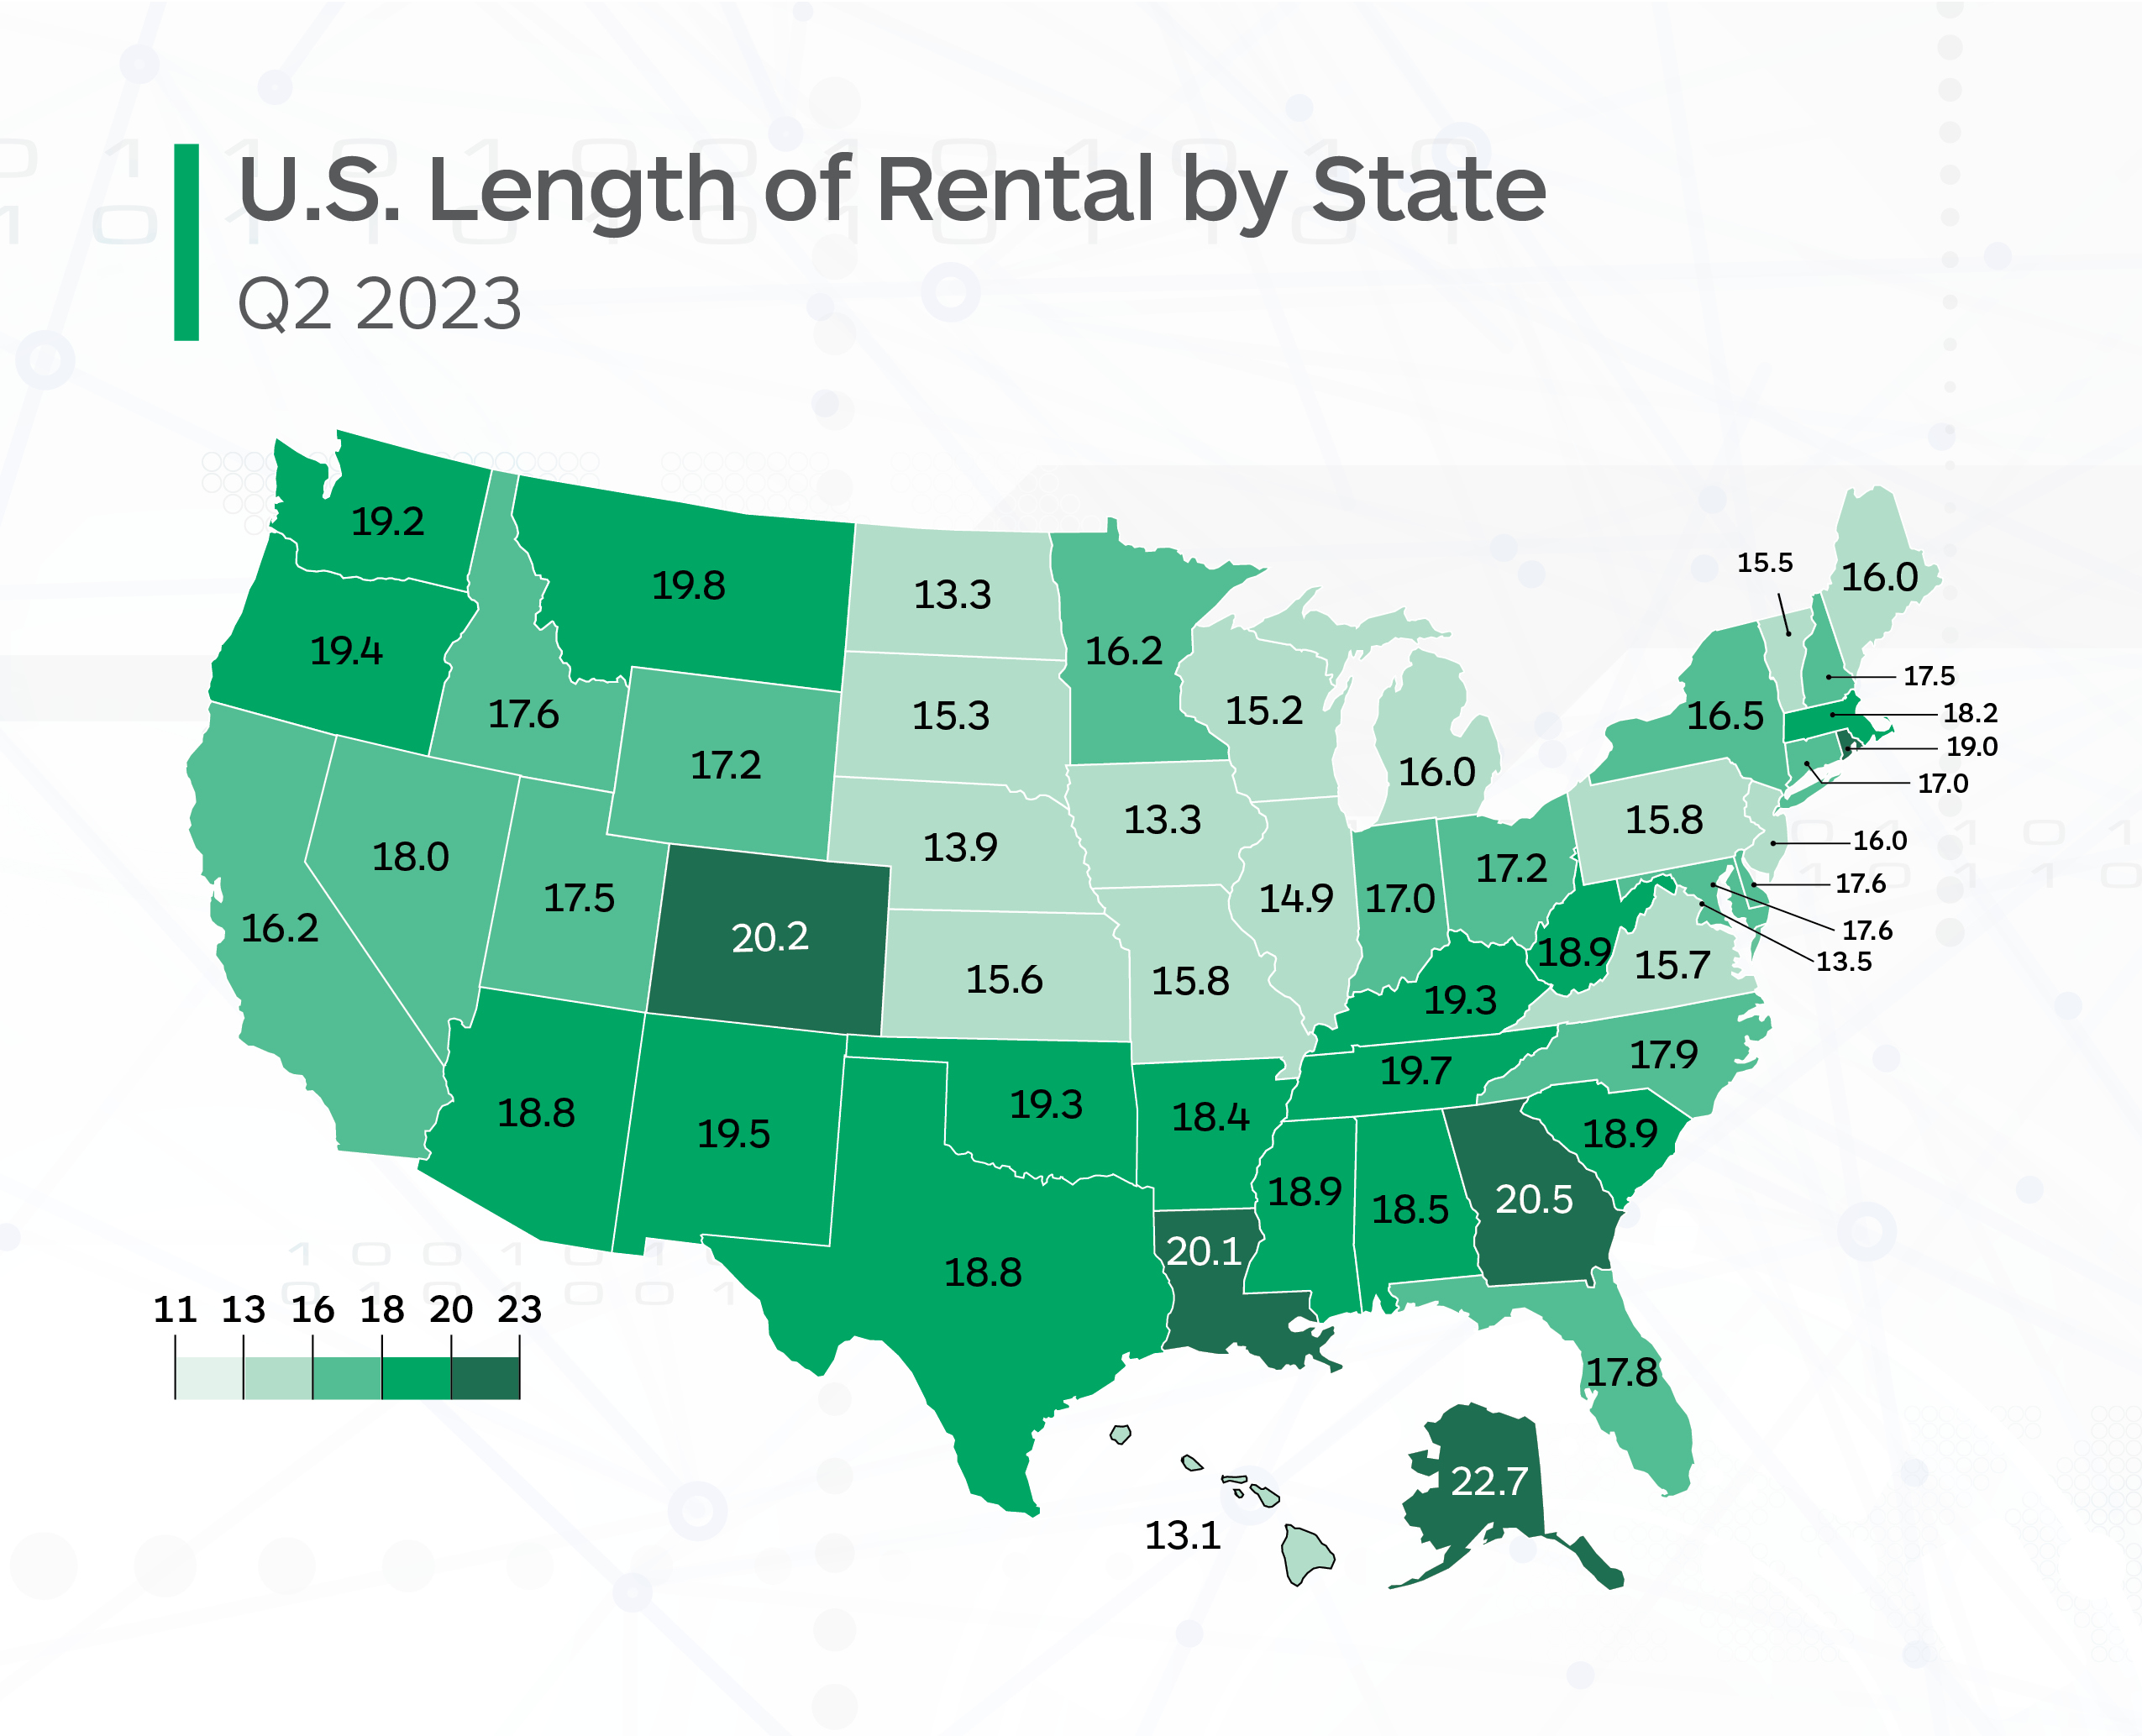
Hawaii had the lowest LOR with 13.1 days. North Dakota and Iowa were next-lowest at 13.3 days each, with Washington D.C. (13.5) and Nebraska (13.9) completing the states that had LORs under two weeks.
Three states saw a YoY increase of a day or more: Minnesota by 1.4, New Mexico by 1.2, and Montana by one. Eighteen states had increases while five other states remained flat.
Twenty-four states and Washington D.C. saw decreases. The largest decreases were Rhode Island by two days, D.C. by 1.9, and Louisiana by 1.8.
Enterprise says that the numbers show a “predictable” seasonal dip in LOR from Q1 to Q2 continued throughout Q2 viewing the LOR decrease as a positive step with many repairers “finding ways to anticipate and operate in the new normal.”
“However, challenging market conditions remain, and overall LOR remains significantly higher than it was pre-pandemic,” Enterprise said.
CRASH Network Editor John Yoswick added, “We’re seeing a number of trends that could account for some — though not a lot — of decline in LOR, at least for now. Shops’ backlog of work tends to drop in the spring, and this year was no exception. The national average backlog was 4.7 weeks in Q2 2023, down from 5.8 weeks the prior quarter.
“Prior to the pandemic, the typical second quarter decline in backlog was about three days. This year, the drop was almost eight days, and the percentage of shops that could schedule a job in two weeks or less increased 14 percentage points to 27%. While that is the highest percentage of shops with a ‘normal’ backlog since October of 2021, it is still far from the pre-pandemic second quarter average of 72%.”
Forty-six percent of shops were still scheduling work four or more weeks into the future during Q2, Yoswick said. “That is a significant decline from 60% in the first quarter of this year but also far from the typical 7% with that length of backlog pre-pandemic.”
He also noted that, according to a CRASH Network survey of 500 shops conducted in June, insurers tend to take two days longer than they did pre-pandemic to send an adjuster in to inspect vehicles prior to repair approvals. Virtual inspections aren’t any faster, according to the survey. Insurers are taking about two days longer going that route compared to 2018.
LOR associated with drivable repairs reached 15.5 days in Q2 while non-drivables reached 25.6. The latter was a decrease of about a day compared to last year’s Q2.
LOR associated with total loss claims was 16.5 days — also a decrease of nearly a day compared to Q2 2022.
“Total loss LOR varied greatly; excluding Alaska, the highest increases were Wyoming at +2.2 days and Maine at +2.1 days,” the report states. “Twenty states (less AK) had an increase of 0.9-days on average. However, 29 states plus D.C. had an average decrease of 1.6 days, with 17 states plus D.C. down an average of 2.2 days.”
Of all repairable estimates, there was a slight increase (nearly half a point, up to 13.28% from 12.79%) in the luxury vehicle parc last quarter, according to Mitchell International Claim Performance Director Ryan Mandell.
“On average, luxury vehicle estimates are written for nearly two additional labor hours (1.83) compared to common make vehicles, as well as an additional 1.3 replacement parts,” he said.
Advanced driver assistance system (ADAS) calibrations frequency also increased from 11.28% in Q2 2022 to 16.11% in Q2 2023, Mandell added.
Images
Featured image credit: Drazen Zigic/iStock
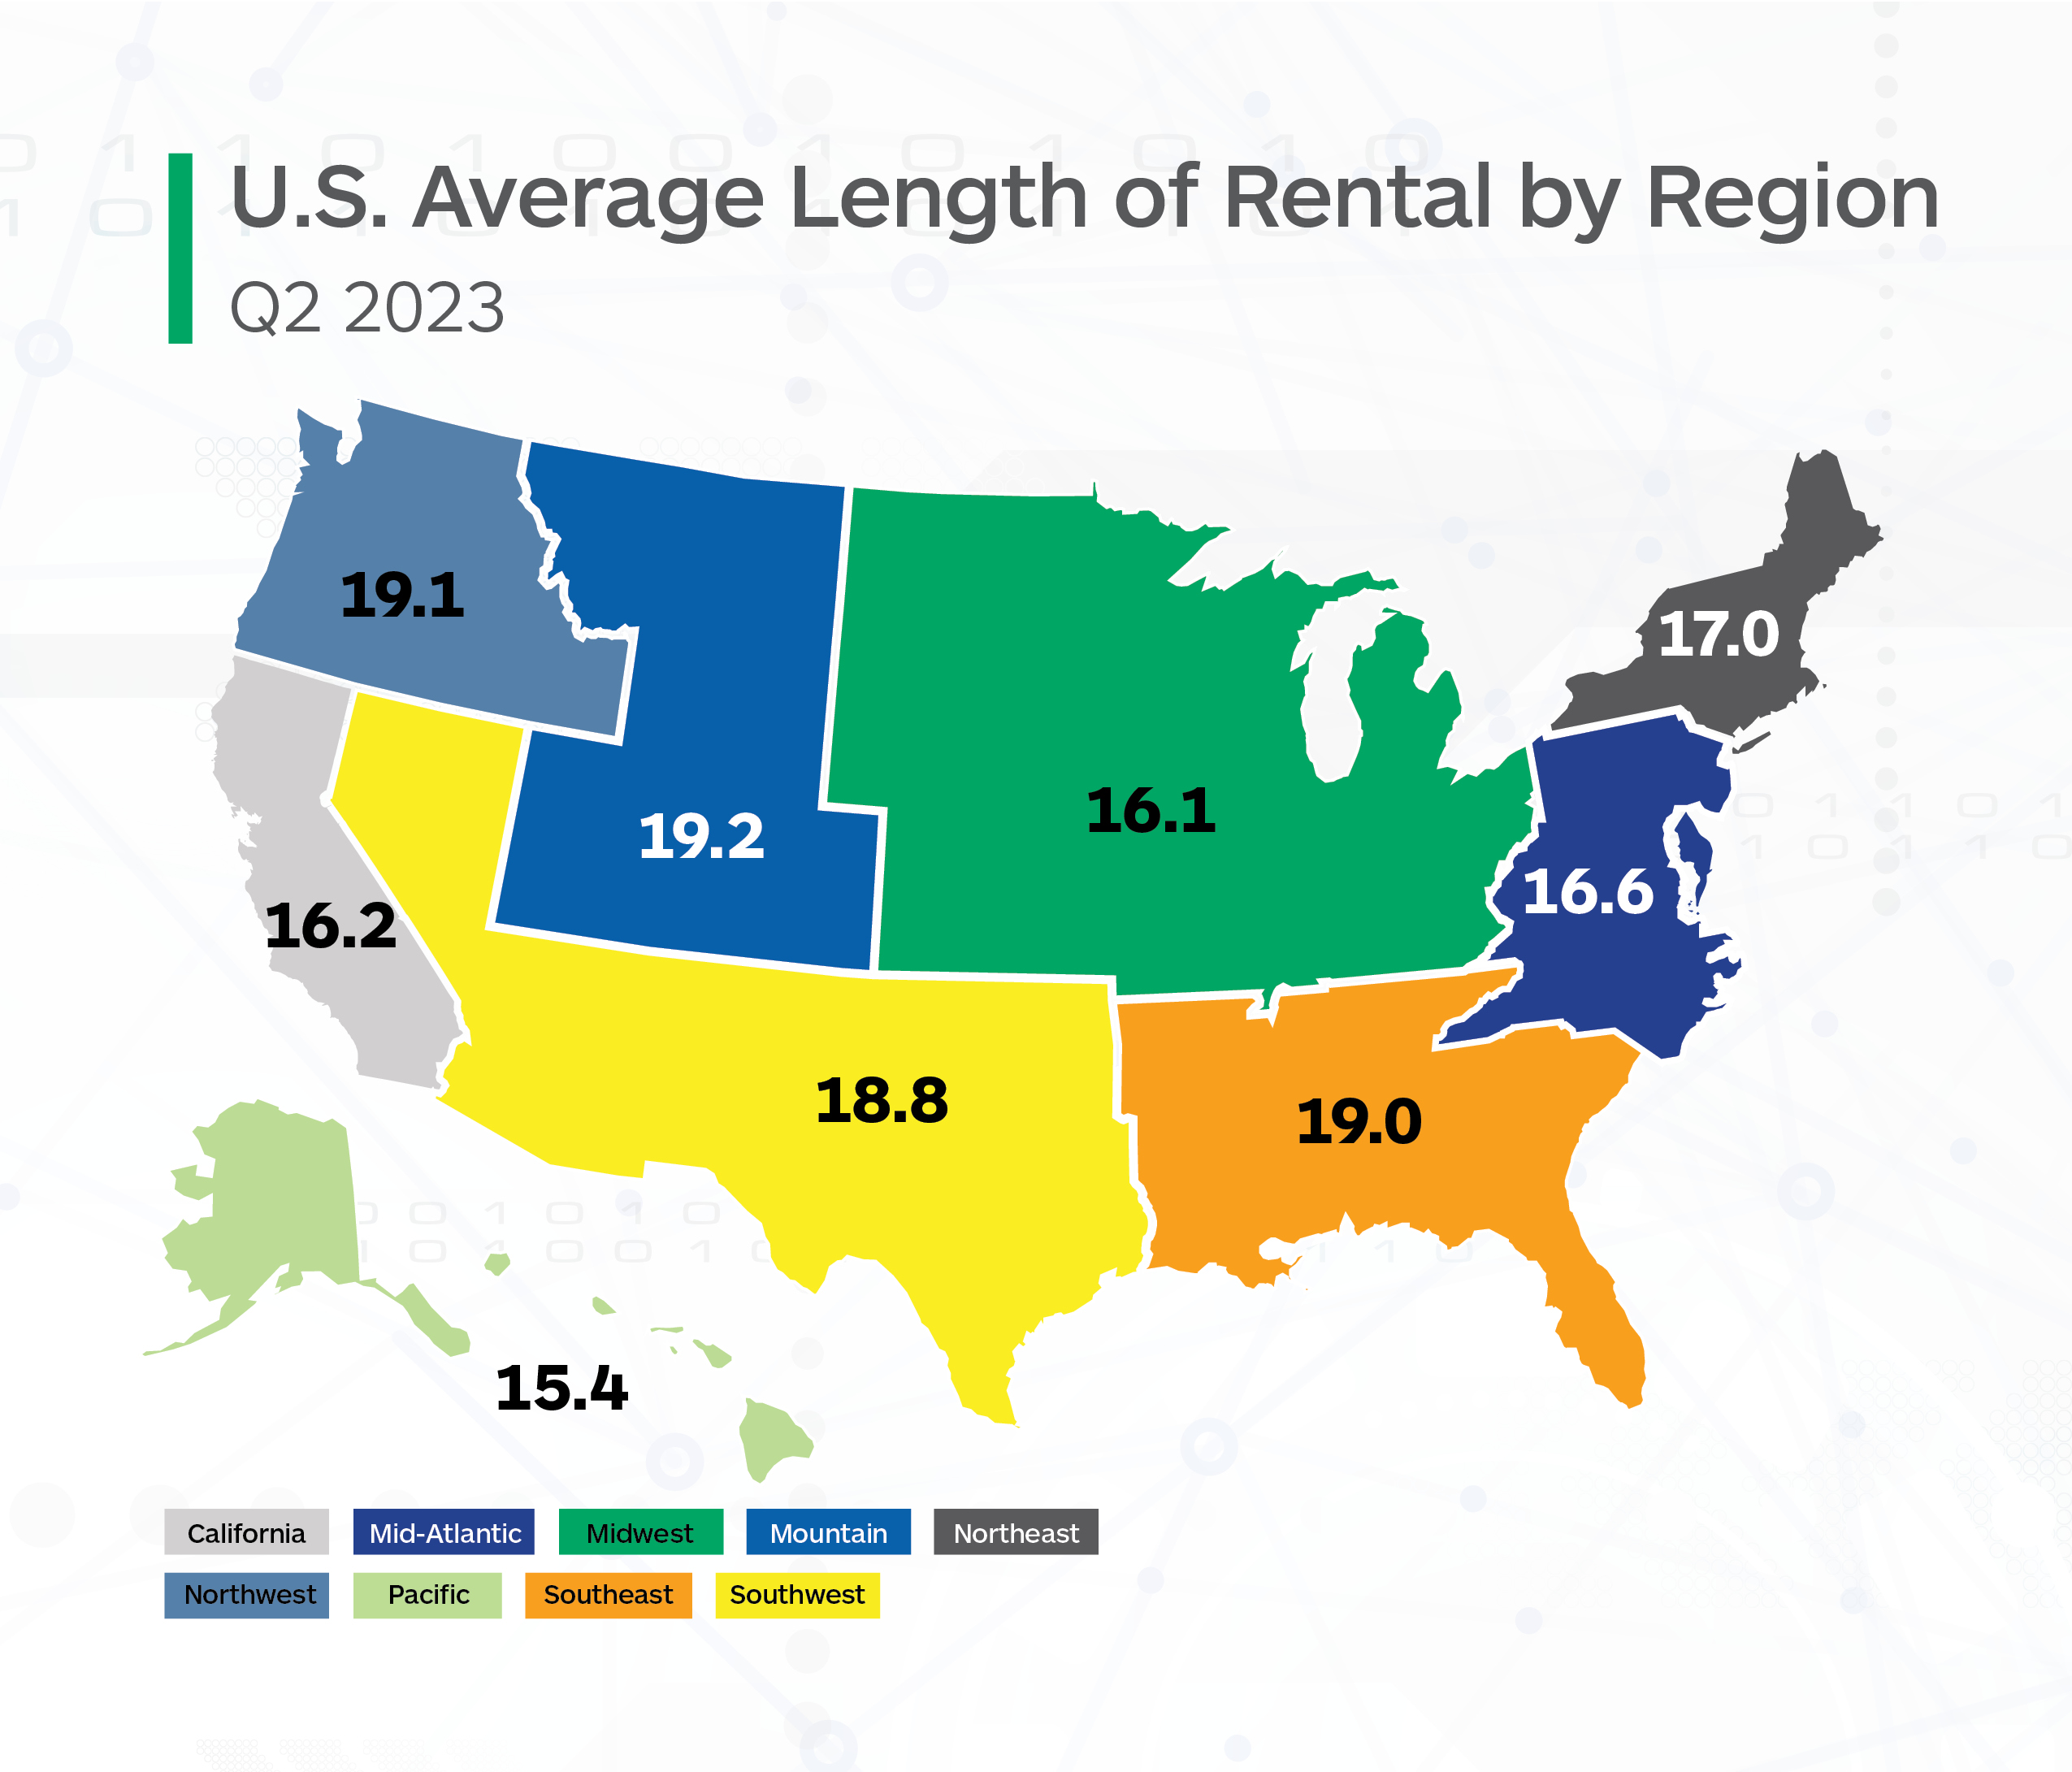
LOR maps provided by Enterprise