As more zero emissions come to market, studies find charging, fuel access remain laggard
By onMarket Trends
While automakers continue to introduce new electric vehicles (EVs) and experience growth in market share, a new study from J.D. Power finds that public vehicle charging infrastructure has not kept pace. Meanwhile, California lawmakers are trying to find a solution to provide more hydrogen fuel station access for fuel cell electric vehicles (FCEVs).
“If anything, it is falling further behind,” J.D. Power says. “The recent move to open Tesla Superchargers to non-Tesla owners could improve the situation but such effort might not be the answer that some suggest, as overall satisfaction continues to decline.”
So far, OEMs that have signed agreements with Tesla to use its North American Charging Standard (NACS) Supercharger network include this includes General Motors, Ford, Volvo, Polestar, Nissan, Rivian, Mercedes-Benz, and Fisker across the U.S. and/or Canada as early as next spring. Fisker plans to begin during Q1 2025. EV charging companies have also said they’ll be adding NACS connectors to their stations.
J.D. Power’s 2023 U.S. Electric Vehicle Experience (EVX) Public Charging Study, based on a six-month EV owner survey, states that despite the increase in public charging stations across the country, customer satisfaction with public Level 2 charging has declined to 617 on a 1,000-point scale, which is 16 points lower than a year ago and the lowest level since the study began in 2021.
The study, now in its third year, measures EV owners’ satisfaction with two types of public charge point operators — Level 2 charging stations and [direct current] DC fast charger stations. Satisfaction is measured across 10 factors (in order of importance): ease of charging, speed of charging, the physical condition of the charging station, availability of chargers, the convenience of the location, things to do while charging, the safety of the location, ease of finding the location, cost of charging, and ease of payment.
There were 15,079 battery electric vehicle (BEV)- and plug-in hybrid electric vehicles (PHEV)-owner respondents to the survey. The study was conducted from January through June of this year.
Though purported to be the wave of the future, satisfaction with DC fast chargers has declined even further, dropping 20 points to 654, J.D. Power said.
“More troubling is that satisfaction in both charging station segments has declined in nearly every attribute measured in the study. Since consumer skepticism regarding public charging availability is the primary reason vehicle shoppers reject EVs, this performance could prove to be a further hindrance to EV acceptance.”
Separate J.D. Power study findings released in June show that 49% of people shopping for a new vehicle rejected EVs as an option due to infrastructure concerns.
A lack of charging availability has been the No. 1 reason shoppers have opted to stick with internal combustion engine (ICE) vehicles since J.D. Power’s Electrical Vehicle Consideration Study was launched in 2021, J.D. Power said. However, most EV owners have said charging is one of the greatest benefits of ownership because 85% of it is done at home.
Still, all of J.D. Power’s EV-related studies have found public charging infrastructure to yield low satisfaction scores.
S&P Global Mobility data has shown that charging infrastructure is not nearly robust enough to fully support a maturing EV market. Even when home charging is taken into account, to properly match forecasted sales demand, the U.S. will need to see the number of EV chargers quadruple between 2022 and 2025, and grow more than eight-fold by 2030, S&P says.
In regard to J.D. Power’s most recent findings, EV Practice Executive Director Brent Gruber said, “The declining customer satisfaction scores for public charging should be concerning to automakers and, more broadly, to public charging stakeholders. The availability of public charging stations is still a critical obstacle but it isn’t the only one.
“EV owners continue to have issues with many aspects of public charging, as the cost and speed of charging and the availability of things to do while waiting for their vehicle to charge are the least satisfying aspects,” he said. “At the same time, the reliability of public chargers continues to be a problem. The situation is stuck at a level where 1 of every 5 visits ends without charging, the majority of which are due to station outages.”
Tesla owners say they’re relatively satisfied with the OEM’s Supercharger network, which earned a score of 745. Using chargers outside of Tesla’s network causes the satisfaction score given by Tesla drivers to decrease by nearly 200 points to 550, according to the study.
“With greater adoption of the North American Charging Standard (NACS) pioneered by Tesla, it may provide a boost in fast-charging satisfaction among owners of EVs from other brands as they begin to use Tesla’s Supercharger stations,” Gruber said. “We’re monitoring whether the use of Tesla Superchargers by non-Tesla owners will affect satisfaction, but the move does help address charger scarcity and offer access to industry-leading reliable chargers. It’s just too early to tell if it can reach the satisfaction levels of Tesla owners who are already part of that fully integrated Tesla ecosystem.”
Key findings of the study include:
-
- Speed of charging has the most significant negative effect on overall Level 2 satisfaction, decreasing 36 points year-over-year to 455. DC fast chargers don’t fare much better as satisfaction with the speed of charging declined 30 points to 588;
- Public chargers should be located where EV owners will most effectively use them. “The data suggests that DC chargers, which charge faster, should be located along travel routes, while Level 2 chargers — essentially used for convenience charging — should be easily accessible near places where EV owners may already be visiting such as retail venues and entertainment venues,” Gruber said.
- 20% of users surveyed said they visited a charger but didn’t due to inoperable chargers or long lines. EV owners in the Miami-Port St. Lucie-Ft. Lauderdale Combined Statistical Area (CSA) as well as the Seattle-Tacoma, Denver-Aurora, and Dallas-Ft. Worth CSAs all had the worst charging experiences with 35% of visits failing to result in charging in Florida and 29% each in the other CSAs.
- The Cleveland-Akron-Canton CSA had the lowest percentage of failed visits with a charging failure rate of 12%.
“The results of this year’s study should be very concerning to all those involved in the transition from gas-powered vehicles to electric vehicles,” Gruber said. “Although the majority of EV charging occurs at home, public charging needs to provide a much better experience across the board—not just for the users of today, but also to alleviate the concerns of skeptical future customers. A lot of work is underway to address these issues but there is certainly much more work to be done.”
Based on J.D. Power’s survey results, Volta received the highest customer satisfaction score (665) among Level 2 charging stations followed by Tesla Destination (661) and ChargePoint (618).
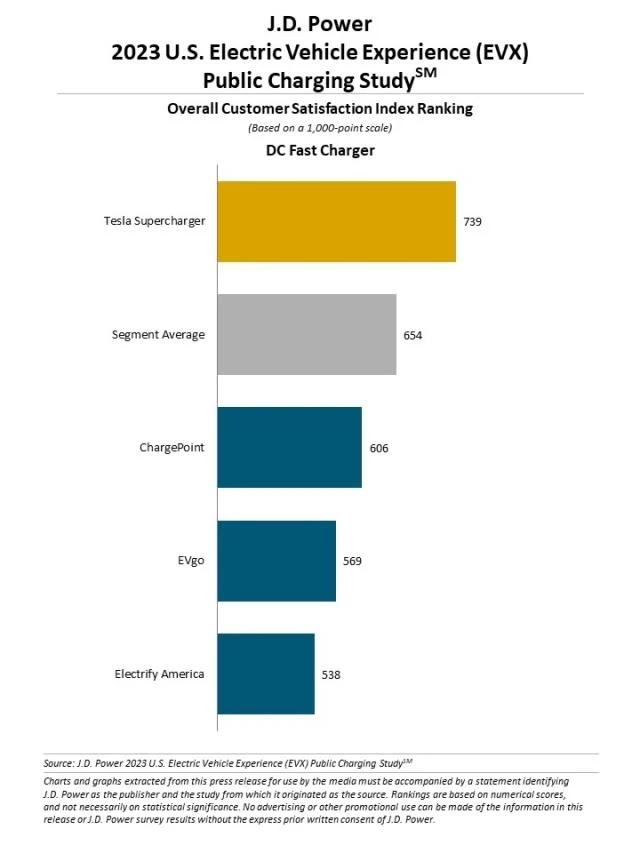
Tesla Supercharger ranks highest among DC fast chargers for a third consecutive year, with a score of 739. It is the only DC fast charger brand to rank above the L2 charging station segment average.
A new study by Coast, a fuel card and expense management company, reveals that there are currently about 104 gas pumps for every 1,000 miles of road compared to 22 EV charging ports in the U.S.
The study used data from the U.S. Department of Energy and the U.S. Census Bureau to compare EV charging port density to gas station pump density.
State-by-state comparisons were found by positioning the number of EV charging stations and gas stations against roadway miles, vehicle registrations, and square miles. A density metric was created to highlight states with better EV charging density than gas station density based on vehicle usage and charging/fueling accessibility.
EV usage vs. charging density, according to Coast’s findings:
-
- Nevada: 49% more EVs per vehicle registration than the national average of 36,000 but 19% fewer EV ports per road mile;
- Oregon: 56% more EVs per vehicle registration but 14% fewer EV ports per road mile;
- Rhode Island: 26% fewer EVs per vehicle registration with 205% more EV ports per road mile; and
- Maine: 47% fewer EVs per vehicle registration and 5% more per road mile.
Comparatively, Nevada has 2% more gas vehicles per vehicle registration than the national average but has 37% fewer gas pumps per road mile. And in Louisiana, there are 2% fewer gas vehicles per vehicle registration than the national average and 43% more gas pumps per road mile.
States with more EV charging ports than gas stations include:
-
- Massachusetts
- Rhode Island
- California
- Hawaii
- Maryland
- Colorado
- Oregon
- Utah
- Washington
How hydrogen power infrastructure measures up
As California continues to be a leader in EV sales and use, state leaders continue to look at how they can help fund clean cars, and what will come to market.
CalMatters, a nonprofit news group, reports that as California steers away from ICE vehicles lawmakers are arguing about the role hydrogen fuel cell vehicles (FCEVs) will play in the future, down to how much money they’ll spend on hydrogen fuel stations.
A lobbying group for hydrogen supporters and suppliers, including Chevron, Shell, and Toyota, is seeking a designated 30% share of money from the state Clean Transportation Program, amounting to $300 million over the next decade, according to CalMatters. And the California Energy Commission has spent $202 million on hydrogen fueling stations.
Only two hydrogen models are available, the Toyota Mirai and Hyundai Nexo, although other OEMs are working on either concept cars or the launch of FCEVs. The vehicle type is mostly sold in California with 1,767 sold in California this year so far. Last year’s sales declined 20% although sales are up this summer, according to CalMatters.
There are 65 light-duty hydrogen fuel stations open in California, according to the California Energy Commission.
“In all, Californians own only about 12,000 hydrogen-powered cars, compared to more than 760,000 powered by batteries,” CalMatters reports. “…Driving a hydrogen car outside of California is virtually impossible: One other public hydrogen fueling station exists in the U.S., and it’s in Hawaii.”
Assembly Bill 241 by Assembly Majority Leader Eloise Gómez Reyes (D-District 50), would designate $10 million a year through July 1, 2030 for hydrogen fueling stations.
Reyes told Politico, “We don’t want to leave money encumbered because that’s money that could be used for other EV stations or technology-neutral stations.”
Politico reports that after more than a decade and some $116 million of state support, California has 63 publicly accessible fueling stations for hydrogen cars and, by 2022 year-end, about 40% of the FCEV global market share.
Images
Featured image credit: Scharfsinn86/iStock
More information
EV startups, Tesla detail higher demand, improving supply chain & production timing