
CCC explores, predicts COVID-19 impact on severity, total losses
By onBusiness Practices | Education | Insurance | Market Trends | Repair Operations
CCC found repair costs, nondriveable vehicle proportions and total losses climbed in March compared to prior years, potentially as a result of altered traffic during the COVID-19 pandemic.
The estimating service reached its conclusions in part using data from the 10th-14th full weeks of 2018, 2019 and 2020 (in 2020, that’d be the four weeks starting March 8). These trends likely continued into April and will continue to impact your collision repair business until states, businesses and citizens ease up on COVID-19 coronavirus precautions.
Using data from Geotab and various media outlets, CCC director and analyst Susanna Gotsch demonstrated Tuesday how reduced traffic meant motorists could drive faster and get into worse crashes.
An April 6 Geotab analysis of seven major U.S. cities found commercial vehicles able to achieve higher average speeds, with New York City seeing average road speeds up 20 percent. The vehicles spent less time stuck in intersections nationwide, and the concept of New York rush hours disappeared after March 15, according to Geotab. The telematics company also found more “harsh driving” by New York City truck operators, though it’s interesting to note this trend didn’t exist in other commercial vehicles.
“There is also a rise in vehicle speed and a slight increase in instances of harsh braking and hard cornering,” Geotab wrote. “Drivers familiar with driving in congested cities are now more liberated in these very same areas, so fleets should carefully monitor driving behavior during this time to help ensure the safety of their employees on the road during this unprecedented time.”
Such driving behavior might have increased the odds a crash left your customers’ vehicles non-driveable or an outright total.
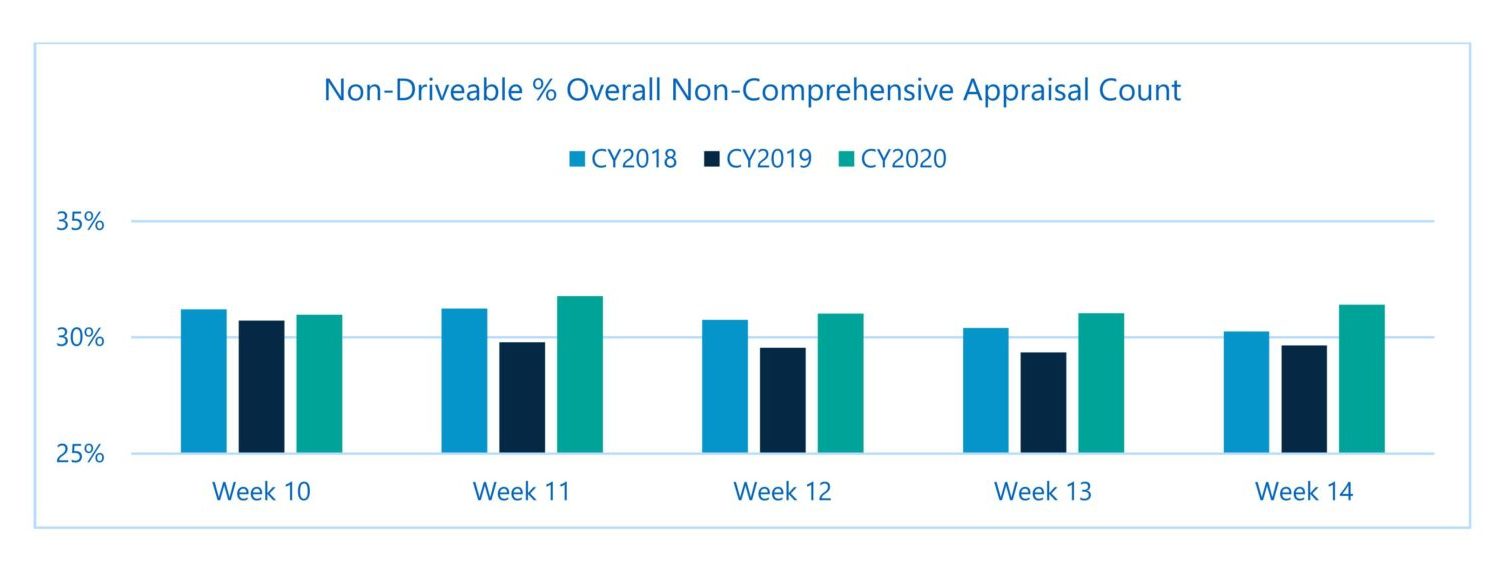
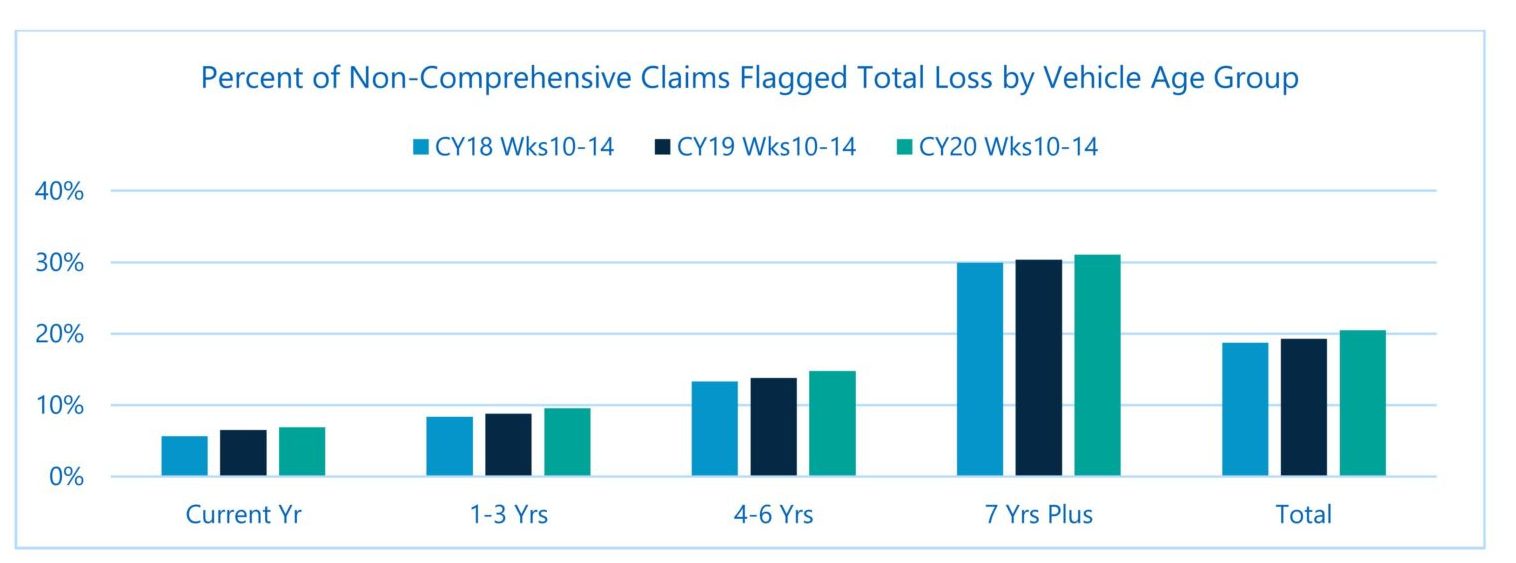
“Analysis of collision and liability auto insurance claims processed by CCC on behalf of its insurance customers from mid-March by week over the last three years reveals an increase in the percent of overall claims flagged non-driveable as well as increase in the percent of claims flagged total loss,” Gotsch wrote Tuesday.
Preliminary estimates to fix the average nondriveable vehicle climbed to around $5,000 by the week of March 29, and the average initial estimate for driveable vehicles climbed as well, according to Gotsch.
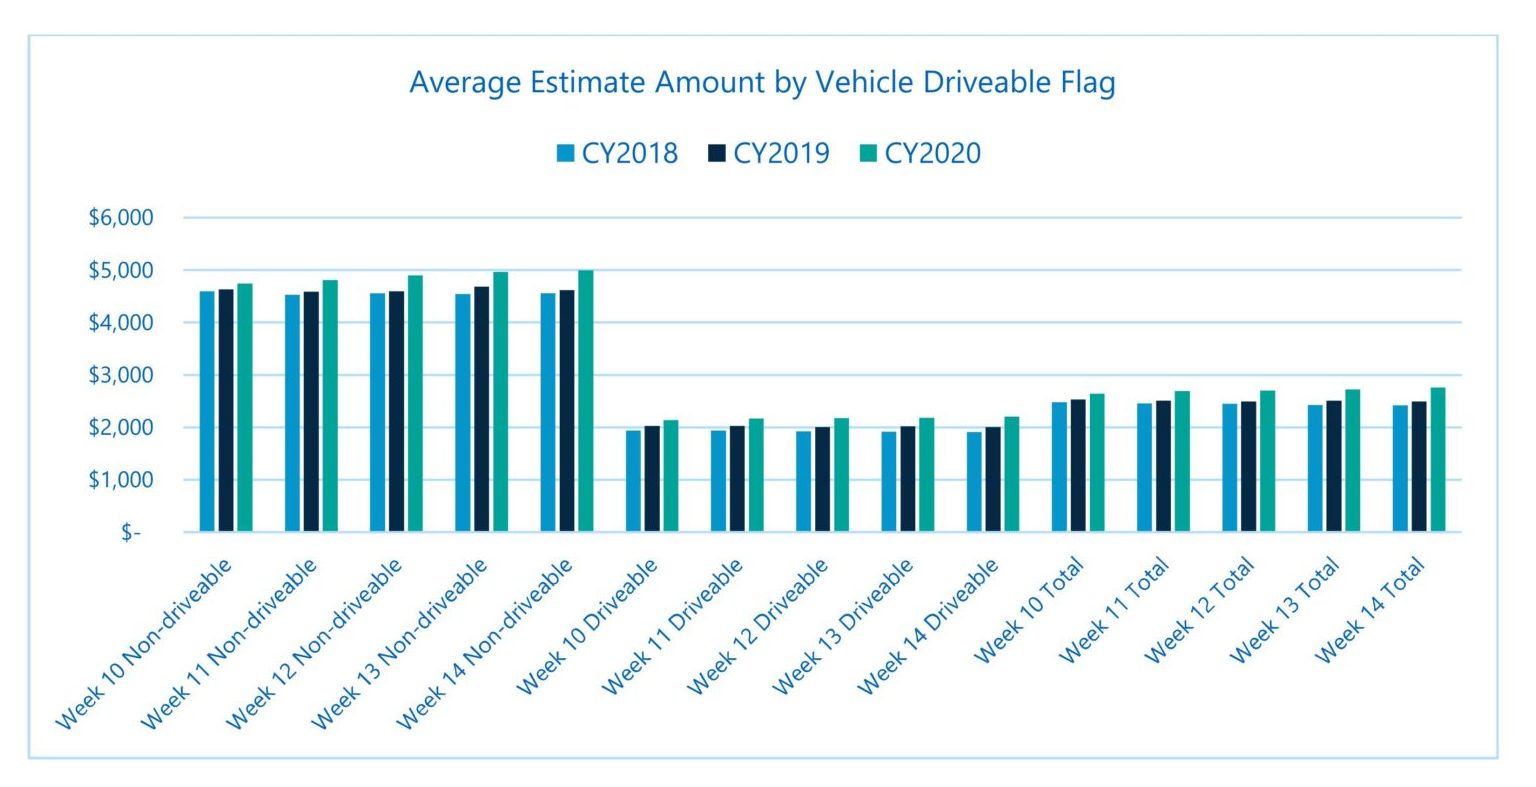
“Overall vehicle repair costs are climbing and climbing faster than in prior years,” Gotsch wrote. “A comparison of the preliminary estimate amount (before any additional costs from supplements factored in) illustrates the increase in both driveable and non-driveable appraisals for CY 2020 claims versus both prior years. And while the average amount fluctuated up and down between weeks in CY 2018 and CY 2019, the average estimate amount steadily increased each week in CY 2020.
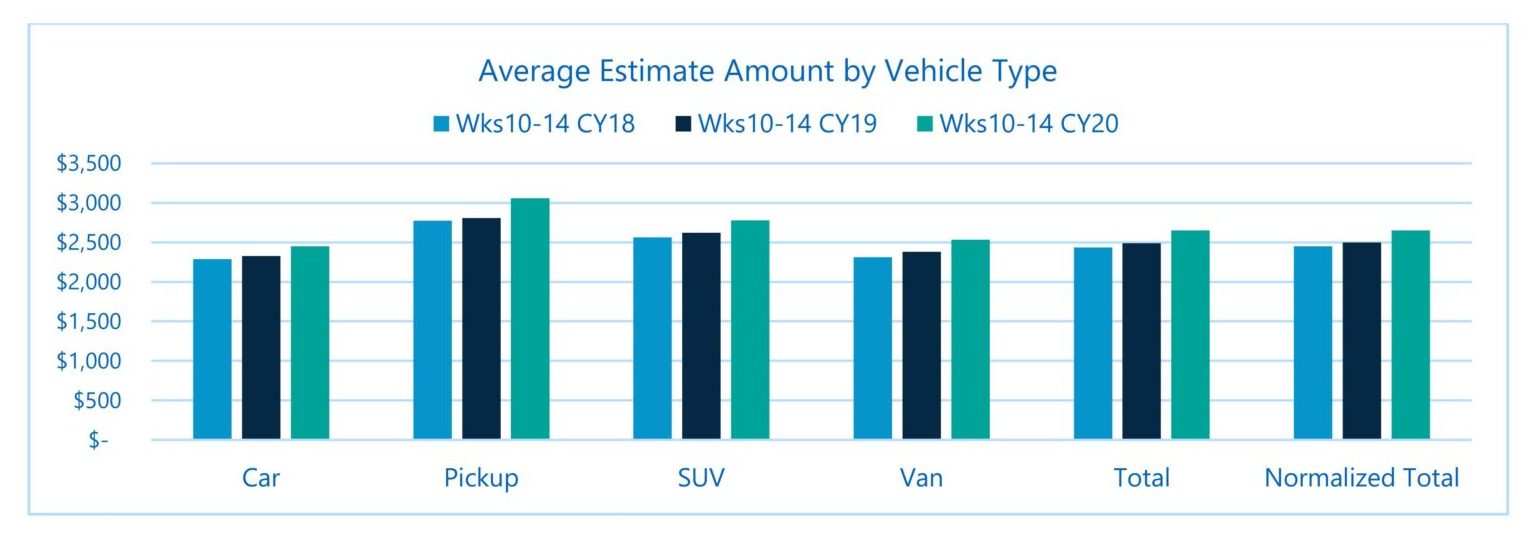
“The average estimate amount is up across all vehicle types as well. Even when normalized for the increased share of light trucks in CY 2020 (52 percent versus 48 percent in CY 2018), the average estimate amount is trending higher for the most current five-week period versus same period in the prior two years.”
And remember, that’s before auto body shops discovered additional damage and submitted it to the customer and insurer with supplements.
“With both the percent of claims with at least one supplement, and the supplement share of overall cost growing each year, overall loss costs for CY 2020 will trend even higher over time,” Gotsch wrote.
Given such data, direct repair program shops also might be unable to meet KPIs on severity — through no fault of their own. This might be something to address with an insurer sooner rather than later. It’ll also be important for both repairers and insurers to manage vehicle owners’ expectations. Based on CCC’s data, it’s increasingly likely the initial estimate has missed something and must be supplemented.
Vehicle prices and totals
CCC offered some interesting context from last decade’s recession to examine how the COVID-19 slump could increase the value of used cars, slow the increase of severity, and ultimately boost total losses further.
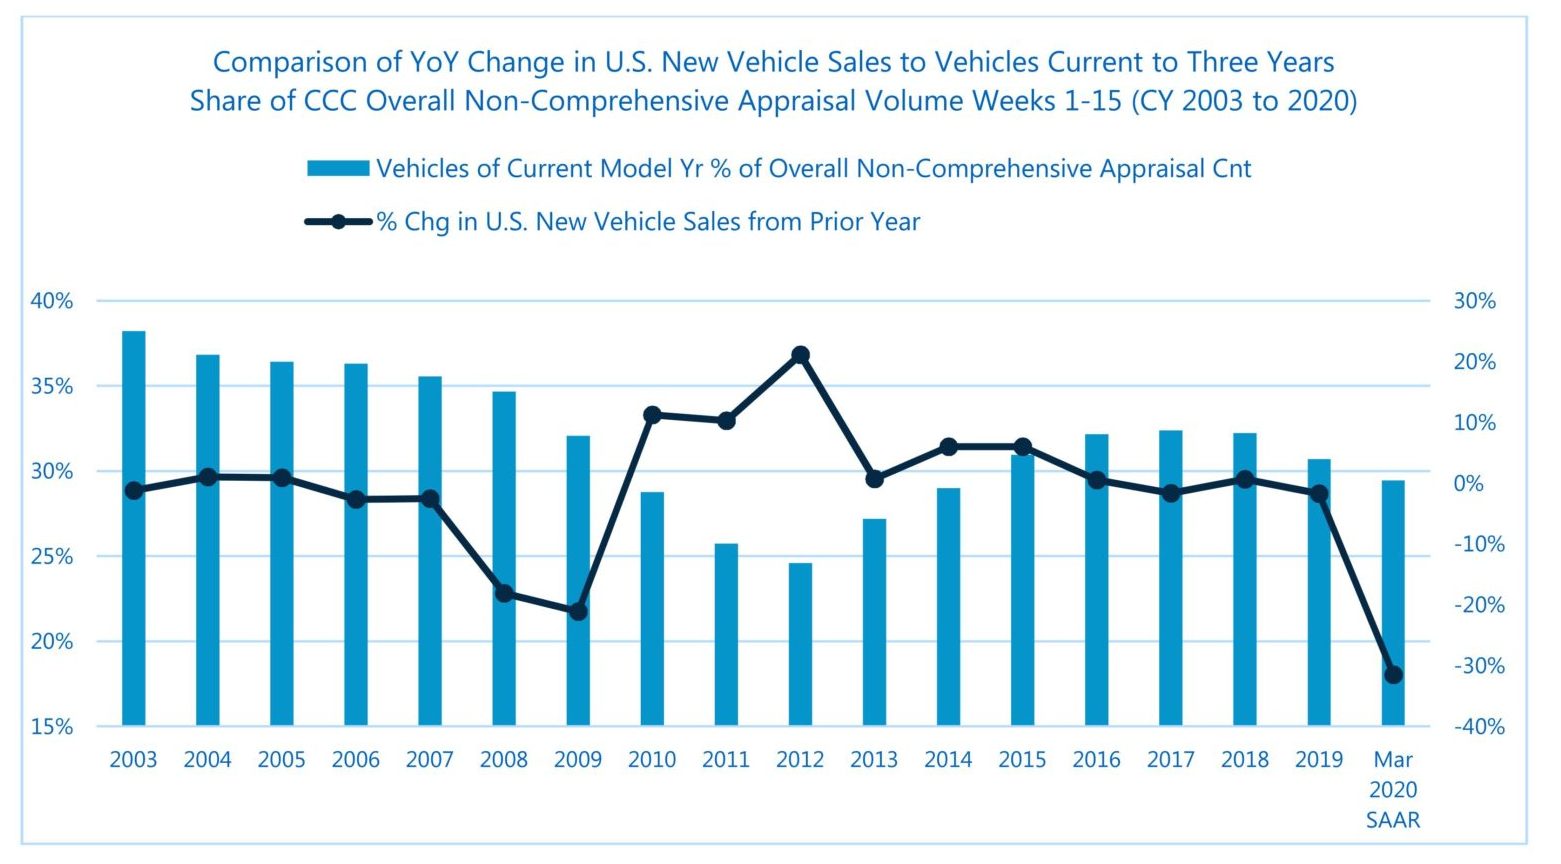
“During the Great Recession, auto sales went from a 10-year run of 16.7M annual new vehicle sales, to roughly 20 percent sales declines in (2008 and 2009),” Gotsch wrote. “With fewer new vehicles added to the vehicle fleet, the fleet skewed older – we will certainly see the same occurring again, particularly as the U.S. already had seen growth in share of older model year vehicles. A comparison of current to three-year old vehicles’ share of overall non-comprehensive appraisal volume for weeks 1 to 15 between CY 2003 to CY 2020 to the change in U.S. new vehicle sales reveals just how quickly the claims vehicle mix is impacted. In fact, claim count share for vehicles current to three-years of age for weeks 1 to 15 fell 0.9 percentage points between CY 2007 and CY 2008, and have fallen already 1.3 percentage points for the same weeks 1-15 between CY 2019 and CY 2020.
“With fewer newer vehicles among the mix, increases in vehicle repair costs will likely slow in coming years. But while average repair costs actually declined between 1-2 percent in the aftermath of the Great Recession, the five-year run of 17 million plus new vehicle sales in the U.S. means there are still a lot of newer vehicles on the road, where additional part replacements, additional labor, and new costs for things like scan and calibration will keep repair costs elevated. Fewer auto sales will slow the gradual decline in the average age of vehicles on the road. And, as we saw during the Great Recession, people may hold onto vehicles longer, leading to higher total loss percentages in the coming quarters.”
J.D. Power on April 16 predicted used vehicle prices would fall 7 percent year-over-year through June 2020 but ultimately only be down 1.7 percent on the whole for 2020. Kelley Blue Book on Friday announced the average vehicle sold for $38,060 in April, with new vehicle prices actually up 2 percent year-over year.
“Although auto sales are expected to drop more than 50% in April, average transaction prices held steady from the earlier months of the year and rose by 2% year-over-year, likely helped by the abundant incentive offers enacted by automakers and finance companies in March of this year,” Kelley analyst Tim Fleming said in a statement. “We observed a bit of a shift in the data this month as more price conscious segments increased more than normal. Car segments that were flat earlier this year showed increases across the board in April. At the same time, luxury segments took a dive, down nearly $1,500 from this time last year, as buyers shied away from these fast-depreciating models.”
Gotsch, who cited a similar April 16 J.D. Power report, predicted that insurers and repairers shouldn’t expect a deflated total loss threshold for too long.
“Retail used prices on older units may hold their values better, since there were already fewer of them due to the sales drop-off during the Great Recession, and historically higher demand for lower-cost vehicles during recessionary periods,” she wrote. “Additionally, fewer new sales in CY 2020 means fewer used vehicles available for sale 2-3 years out. This is what happened during the Great Recession, and by CY 2011, used vehicle prices increased sharply. So, while total loss costs may see some short-term decline, over time, costs can be expected to rise again.”
Frequency, severity and the bill industrywide
It’s interesting that despite the elevated severity Gotsch observed, insurers have offered to credit billions in premiums to consumers in a nod to reduced travel nationwide. (And therefore a reduced risk of crashes and claims.)
Citing statistics from Streetlightdata.com, the University of California, Davis’ Road Ecology Center estimated as of April 30 that miles traveled had fallen 71 percent nationwide. “All states had >60% reduction in local travel, suggesting that the majority of people were taking guidance about staying at home seriously,” the UC-Davis center wrote. It also estimated as of April 15 that Democratic Gov. Gavin Newsom’s shelter-in-place order had cut crashes in half on highways statewide.
The insurer behavior demonstrates how a decline in crashes might trigger a tipping point where the insurer’s savings from lower frequency outweigh the losses from higher severity.
By extension, this suggests that higher repair bills might not be enough to protect collision repairers from a reduction in revenue if volume falls below a certain point. In that sense, the COVID-19 slump might give repairers a dry run of a future in which ADAS significantly eats into frequency but potentially adds severity and complexity to repair bills. That said, ADAS’ impact on frequency isn’t going to be anywhere near the consequences of governors directly or indirectly banning most U.S. miles driven. But that “tipping point” might still arise.
On the plus side, there’s always a chance for nature throw repairers a bone during the pandemic or during a more ADAS-prevalent future — as UC-Davis noted had occurred during the COVID-19 response.
“Total and injury/fatal crashes increased during and following heavy rains, primarily in Southern California,” the Road Ecology Center wrote in highway data referenced by Gotsch. “Even though traffic volumes did not change during these times, injury/fatal crashes briefly returned to their ‘normal’ levels of 1,000-1,500 crashes per day.”
More information:
“Emerging Auto Accident Trends with COVID-19”
CCC, May 5, 2020
“The impact of COVID-19 on congestion and commercial traffic in cities”
Geotab, April 6, 2020
University of California, Davis Road Ecology Center, April 15, 2020
Images:
A Los Angeles-area highway is empty during the COVID-19 pandemic of 2020. (DutcherAerials/iStock)
CCC found non-driveable vehicle claims climbed in the four weeks starting March 8, 2020, over weeks 10-14 of the prior year. This might have been driven by the COVID-19 coronavirus response clearing roads and permitting higher speeds. (Provided by CCC)
CCC found initial estimates climbed in the four weeks starting March 8, 2020, over weeks 10-14 of the prior year. This might have been driven by the COVID-19 coronavirus response clearing roads and permitting higher speeds. (Provided by CCC)
CCC found total losses climbed in the four weeks starting March 8, 2020, over weeks 10-14 of the prior year. This might have been driven by the COVID-19 coronavirus response clearing roads and permitting higher speeds. (Provided by CCC)
CCC found fewer new vehicles appearing in March claims compared to prior years, possibly due to vehicle sales declines in 2018 and 2019. (Provided by CCC)