
CCC examines collision industry trends in depth in 2022 Crash Course
By onAnnouncements | Market Trends | Technology
The pandemic has brought permanent changes to the collision repair industry, accelerating the pace of technological innovation, CCC Intelligent Solutions concludes in its 27th annual Crash Course report released today.
“After tracking key trends for so many years, we can confidently say the P&C insurance and automotive industry landscape has been forever changed,” said Susanna Gotsch, the report’s author.
“The disruption experienced over the last two years has accelerated the pace of innovation driven by everything from supply chain and labor to climate c hange. There is more urgency than ever for the industry to adapt and evolve, with an increased focus on the advancement of digital technologies, user experience and connected networks foundational to change and growth,” Gotsch, senior director and industry analyst, CCC, said.
Crash Course 2022 takes a data-driven look at a number of topics, including changes in driving behavior, the increasing adoption of photo estimating and other digital technology, repair costs, factors affecting in cycle times, and the effects of climate change.
The free, 105-page report can be downloaded here: https://cccis.com/crash-course-2022/. It represents a resource for body shops, who can use it to understand trends affecting collision repairs, Gotsch told Repairer Driven News.
She said repairers may find the report useful “because of all of the significant increases that we’ve seen in repair costs, understanding the drivers behind that and how maybe to have that conversation with others that might not be aware. And even from the standpoint of helping consumers understand, ‘Why is it taking my car longer to get repaired? Why is it costing more?’ Those types of uses.”
Here are a few topics examined in the report:
Costs of repair
The average repairable vehicle estimate in CCC rose by 8.3%, to $3,718, and incorporated an hourly body rate that increased by just 1%, to $52.86.
Repair as a percentage of the total repair bill dipped slightly, to 39.1%, while supplies rose 6.34%, to 22.6%. The average number of parts replaced per claim rose by 0.6, to 11.7.
The share of replacement part dollars was split at 64.4% OEM, against 35.6% aftermarket. The report details a significant growth in the number of parts needed per repair over the past two decades, growing from 5.1 parts to 9.1 parts for driveable vehicles, and from 18 parts to 22.3 parts for non-driveable vehicles.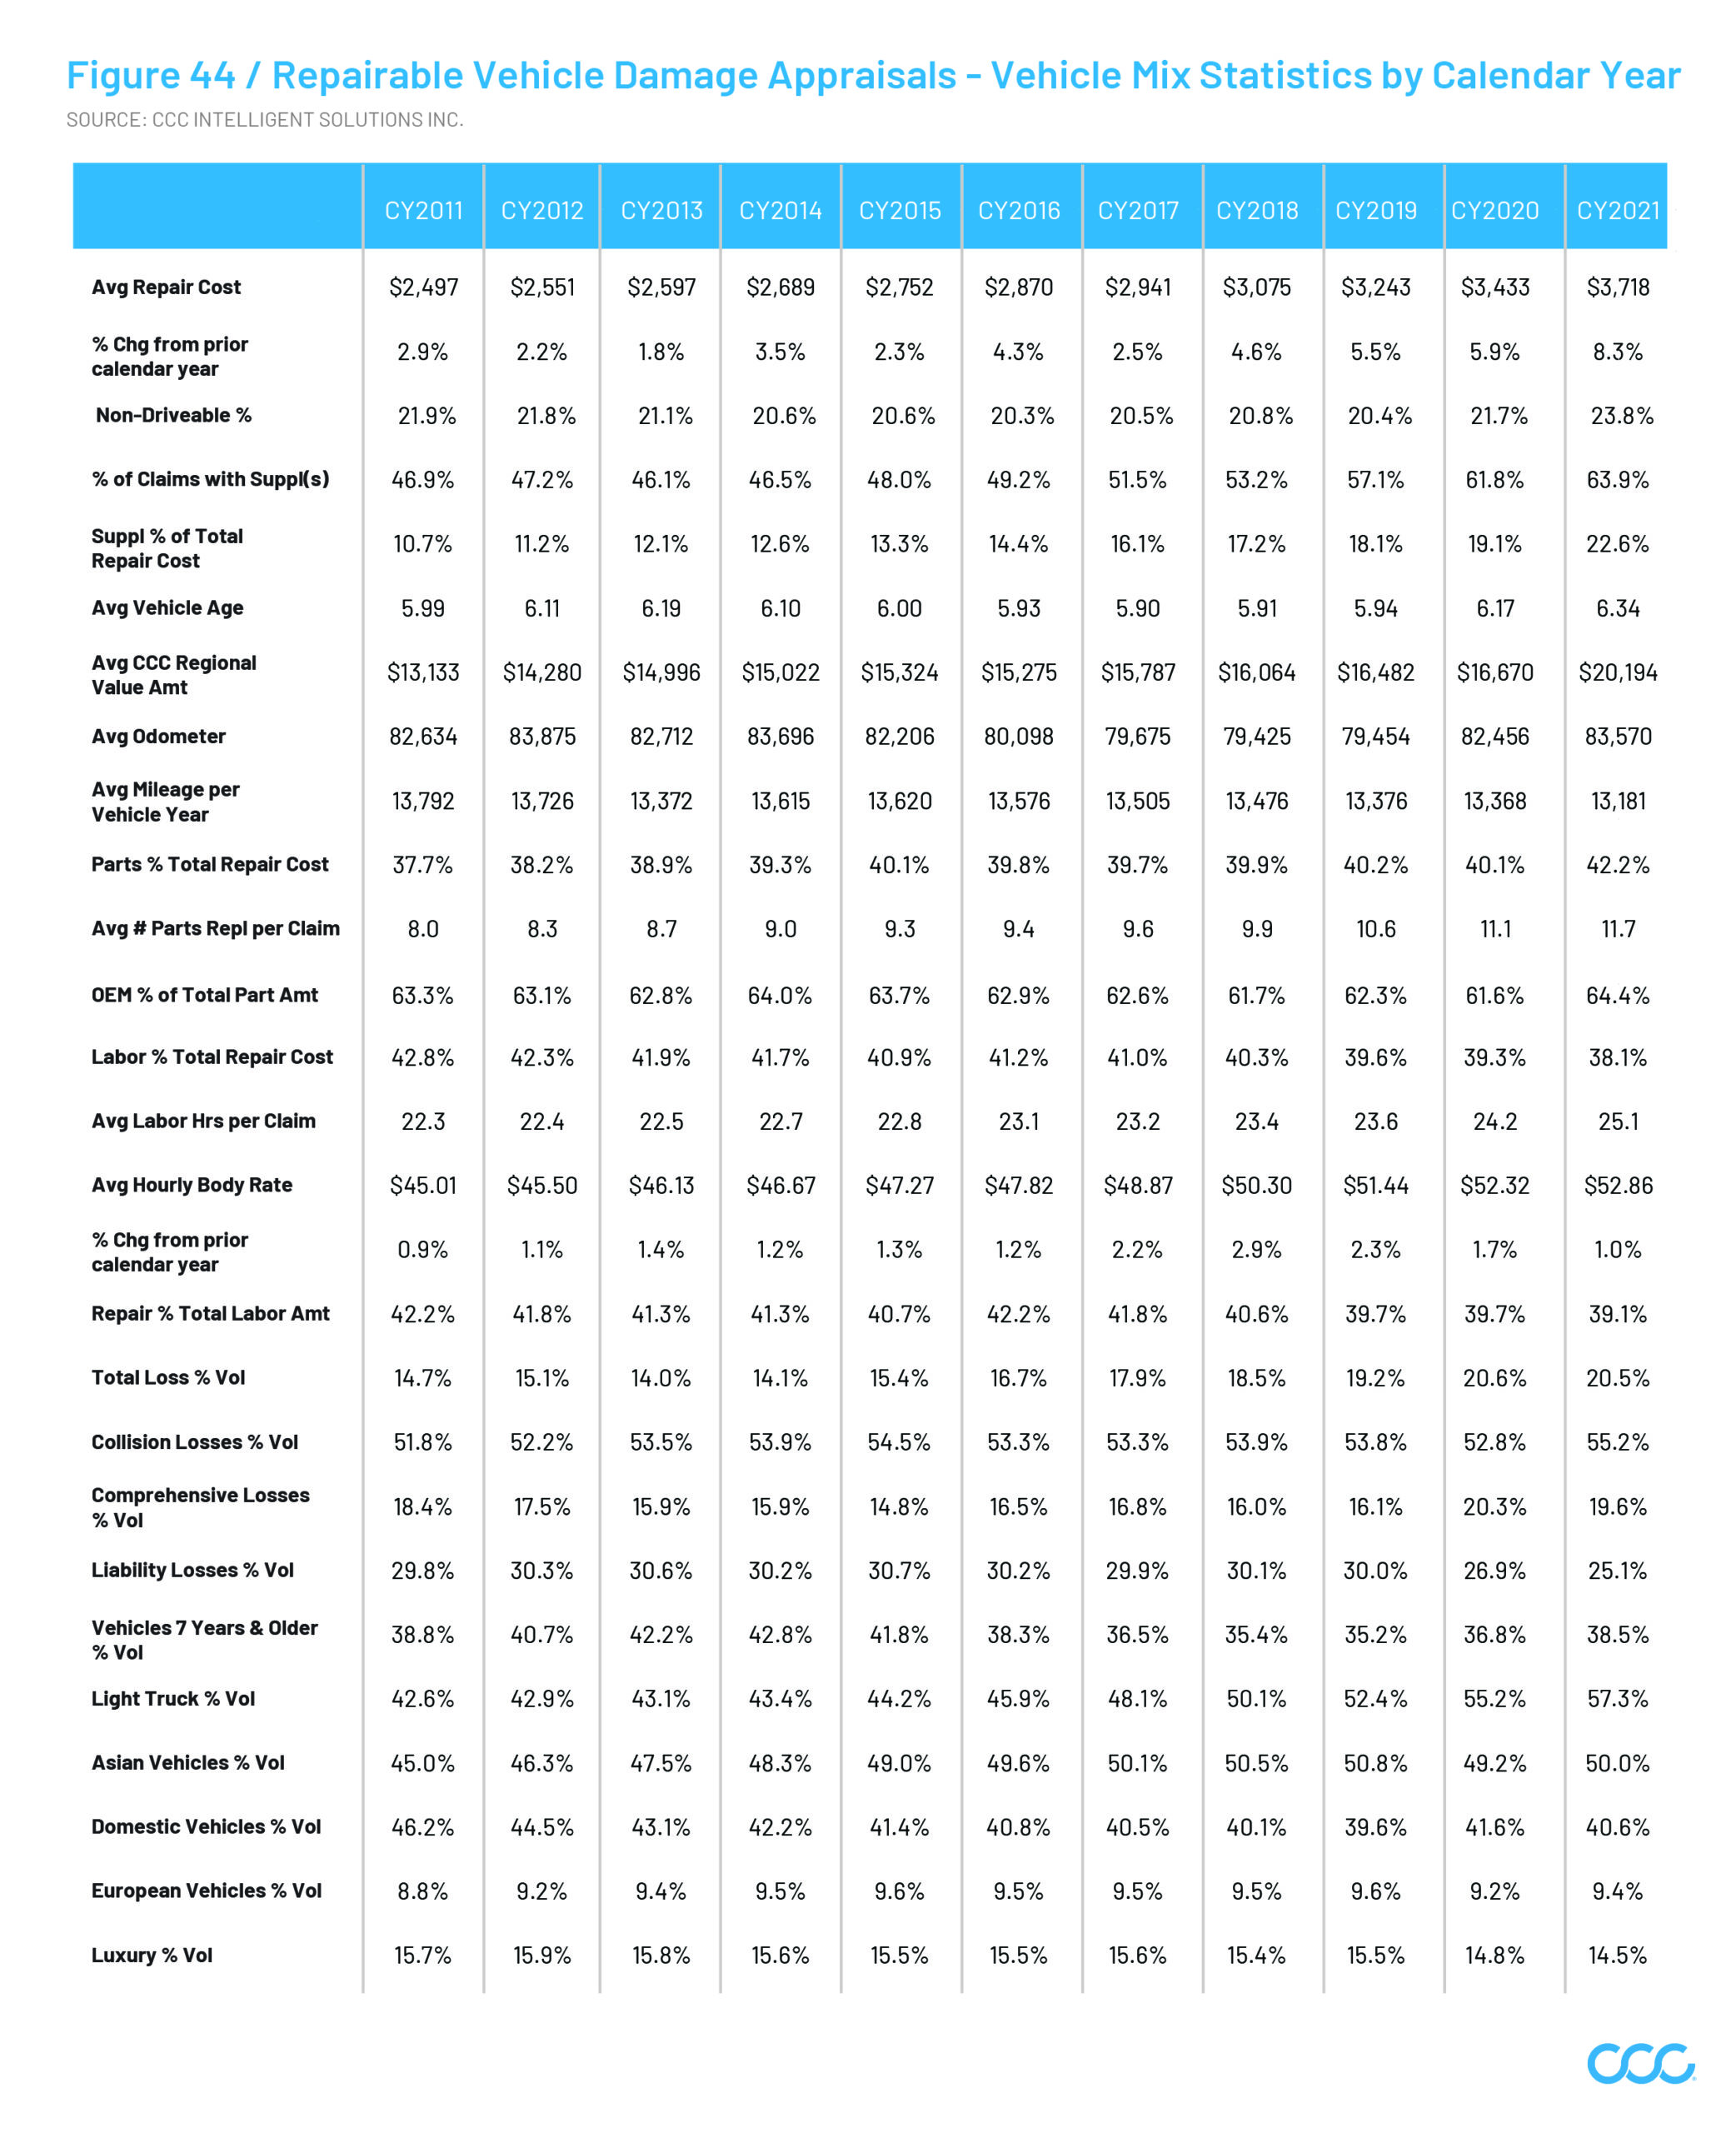 The growth in the number of replacement parts, coupled with the rise in parts prices, has led to a sharp increase in parts costs as a share of overall repair costs.
“Historically, as manufacturers have added more capabilities into the car and more features,” Gotsch said, “that adds additional components to the car, in many cases around the periphery of the vehicle,” where they’re particularly vulnerable to damage.
“Often those parts cannot be repaired, they have to be replaced,” she said, such as plastic bumper covers, and other plastic components. “There are more plastic components in general on cars, components of other material types that maybe can’t be repaired easily anymore. Particularly if you don’t have the right technicians, or you have a shortage of technicians and you’re interested in getting that repair turned around as quickly as possible.”
Beyond that is a spike of 8% in parts prices over 2021, as a direct result of supply chain issues and higher raw materials costs, she said.
“All of that led to a sharp increase in the cost of parts, combined with the number going up, and it adds a lot to the bottom line,” she said.
A rise in the percentage of non-driveable repairs, which require more parts, has also added to costs, Gotsch said. Between 2017 and 2019, she said, non-driveable vehicles accounted for about 21%. In 2021, they accounted for more than 23% of the total, in part because of changing driving patterns attributed to the pandemic.
Labor rates
Although the increase in labor rates between 2020 and 2021 was modest, Gotsch said there are already indications that it will have a much greater effect on costs in 2022.
“Repairers are starting to ask for larger increases in rates and nationally, we’ve seen rates increase as much as three to five percentage points already,” she said.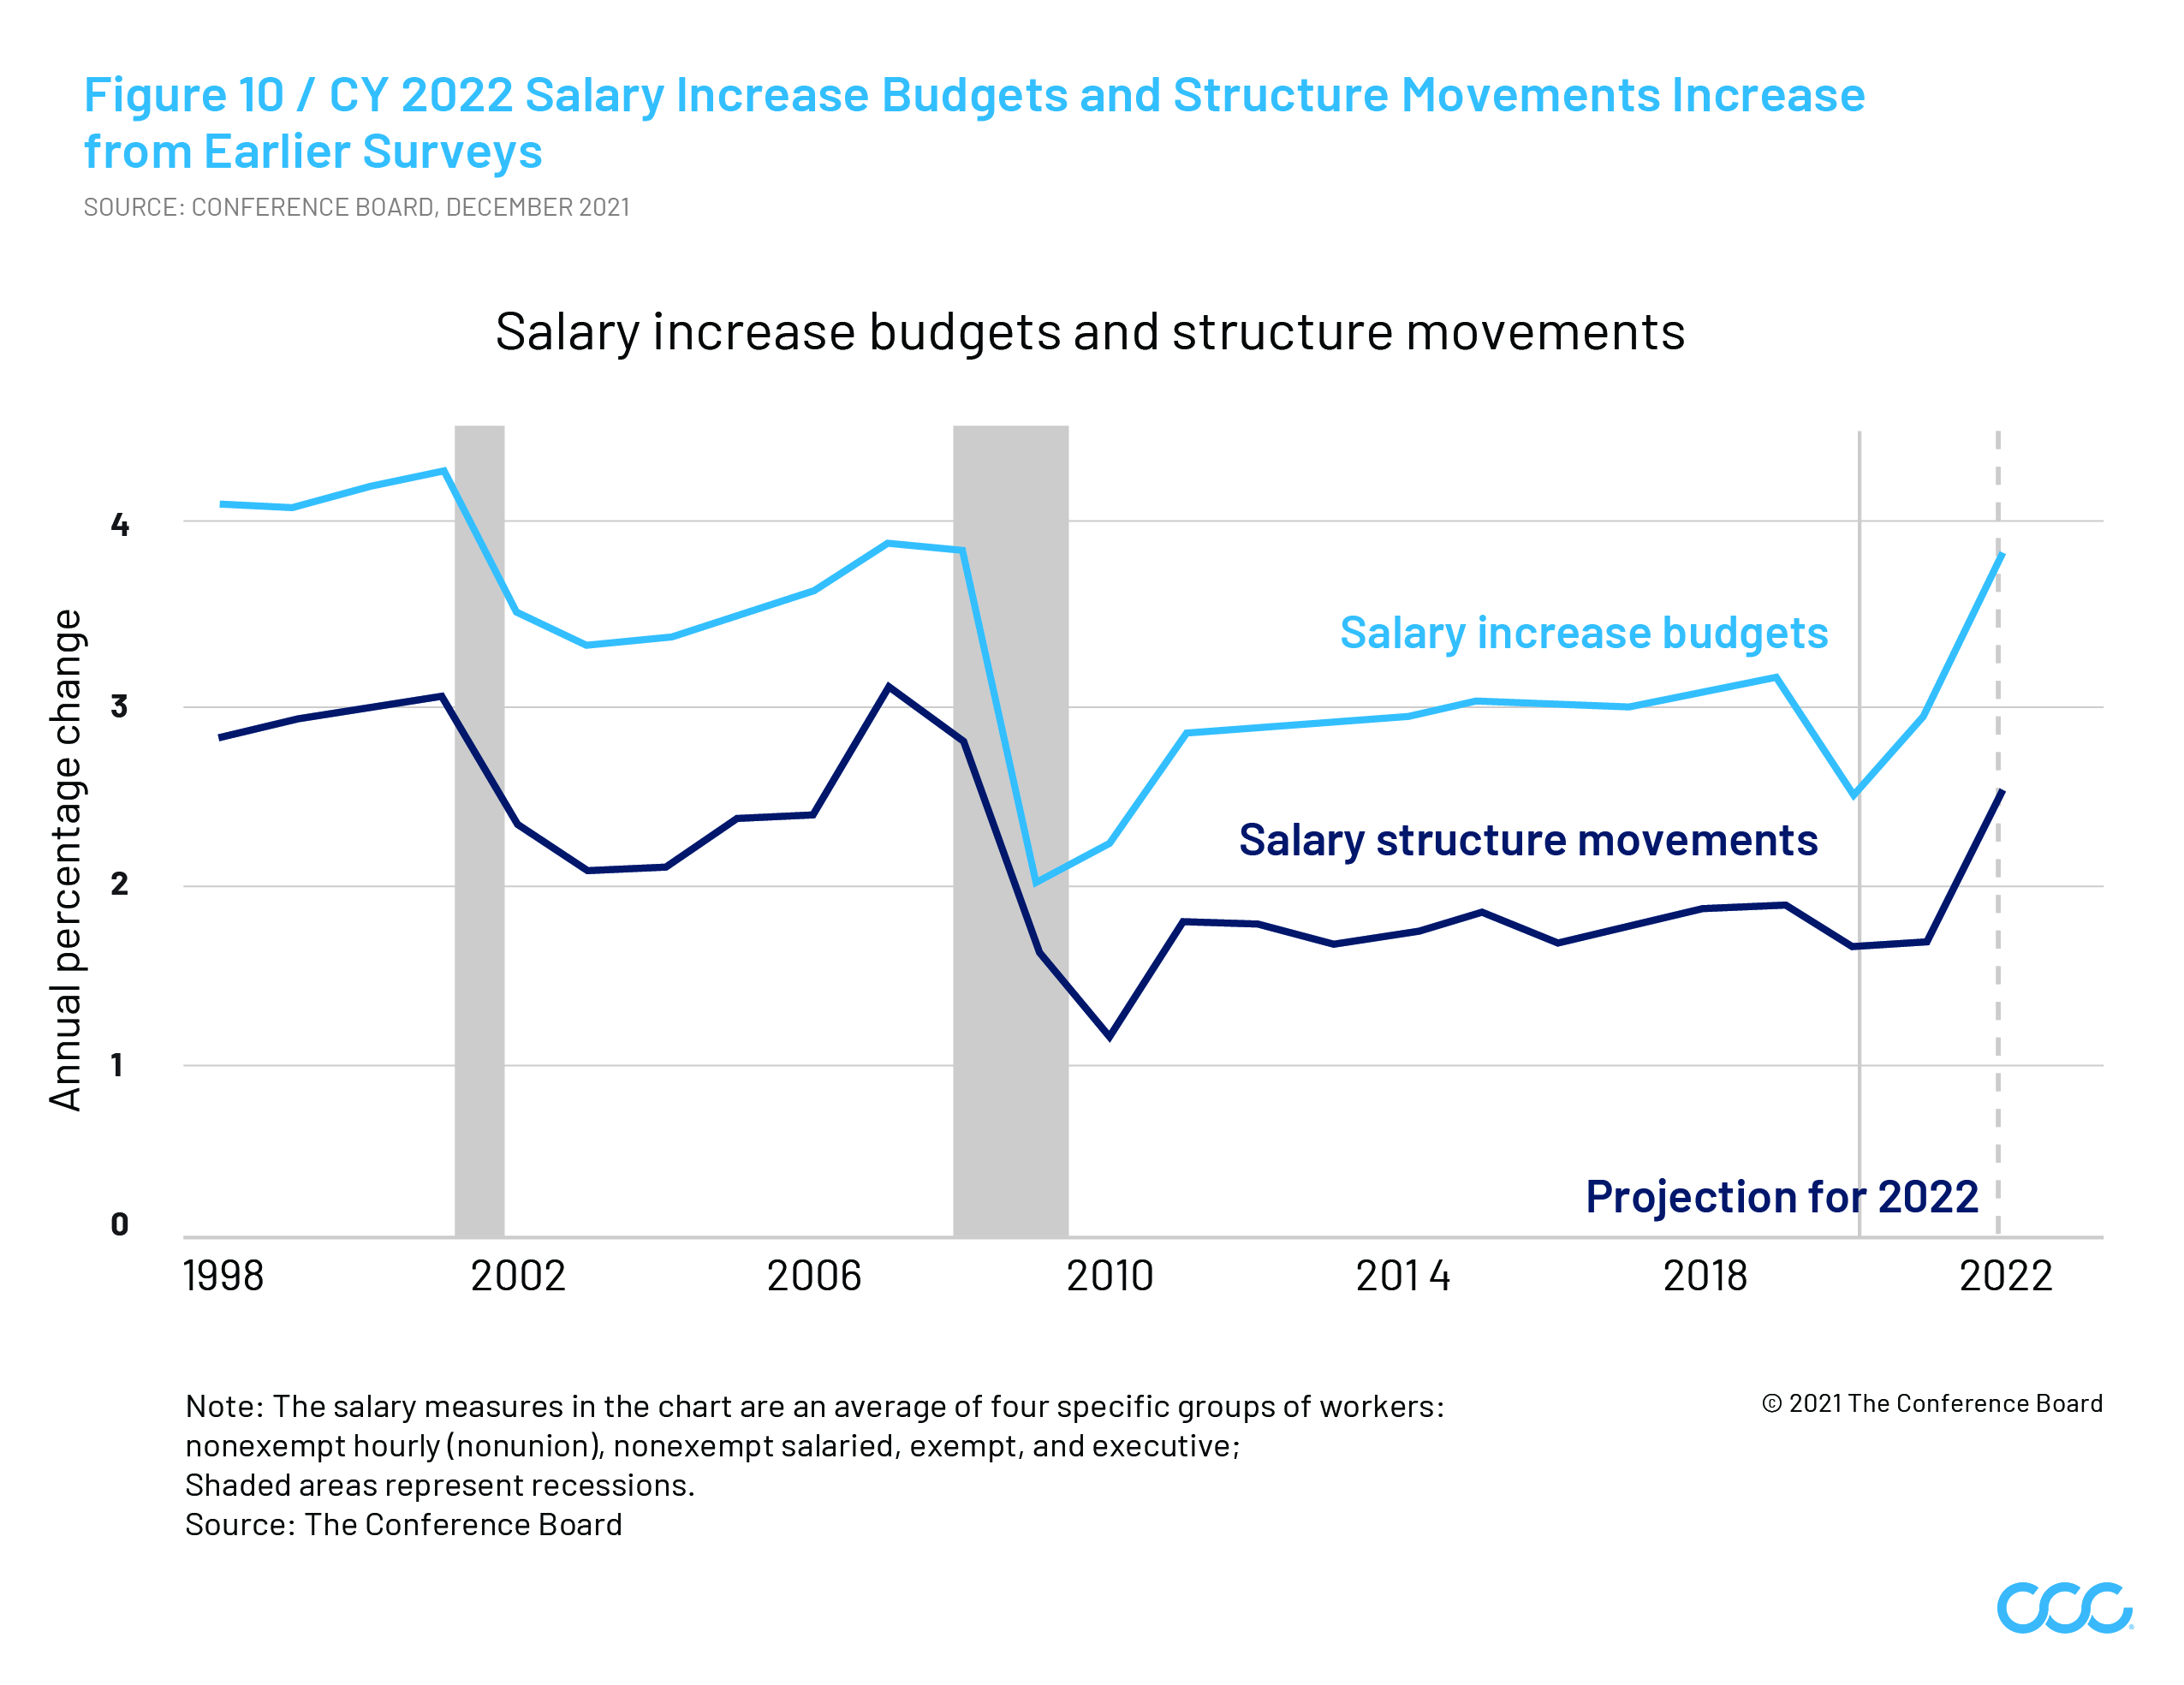 The November Conference Board Salary Increase Budget Survey found companies budgeting for large increases in salary budgets and structures, and projected a 3.9% increase in dollars allocated for the year, a jump from 3.0% April 2021.
“With severe labor shortages anticipated through 2022, overall wage growth is likely to remain above 4%, with wages for new hires, and workers in blue-collar and manual services jobs anticipated to grow faster than average,” the report states.
The collision repair industry, already “struggling to find employees,” finds itself in competition with fast-food restaurants and even car washes for its entry-level positions, Gotsch said. “If you’re going to continue to attract people into the industry, you got to be able to pay those people even at the lowest level of qualification, because otherwise, they’re not going to be interested in joining the industry.”
Digital claims
Over the past several years, insurers have increased their investment in digital technologies, such as photo estimating, the digital exchange of documents, and online shop scheduling in response to consumer demands, CCC said.
The report notes that the pandemic “changed customer expectations further, where insurers are now expected to have a more customized, simplified experience.”
And yet, consumers have not been happy. The J.D. Power 2021 U.S. Claims Digital Experience Study found that the insurance industry lags behind financial services providers and utilities in customer satisfaction and that consumers have been slow to adopt the technology.
The Claims Digital Experience Study reports that “none of the most important key performance indicators are achieving even a 50% success rate and adoption remains stubbornly low.” It found that during 2021, just 40% of claimants interacted with an estimator through a digital channel, and only 47% made a claim through a website.
CCC noted that the J.D. Power 2021 Auto Claims Satisfaction study found year-over-year increases in performance across five of six factors measured in the study: first notice of loss (FNOL), claim servicing, estimation process, repair process, and settlement.
“Overall satisfaction rose to a record high of 880. As insurers add technology to support straight-through processing (STP) or low-touch experiences, satisfaction improves. Claims, where interaction with three or more representatives was needed had the lowest levels of satisfaction,” CCC reported.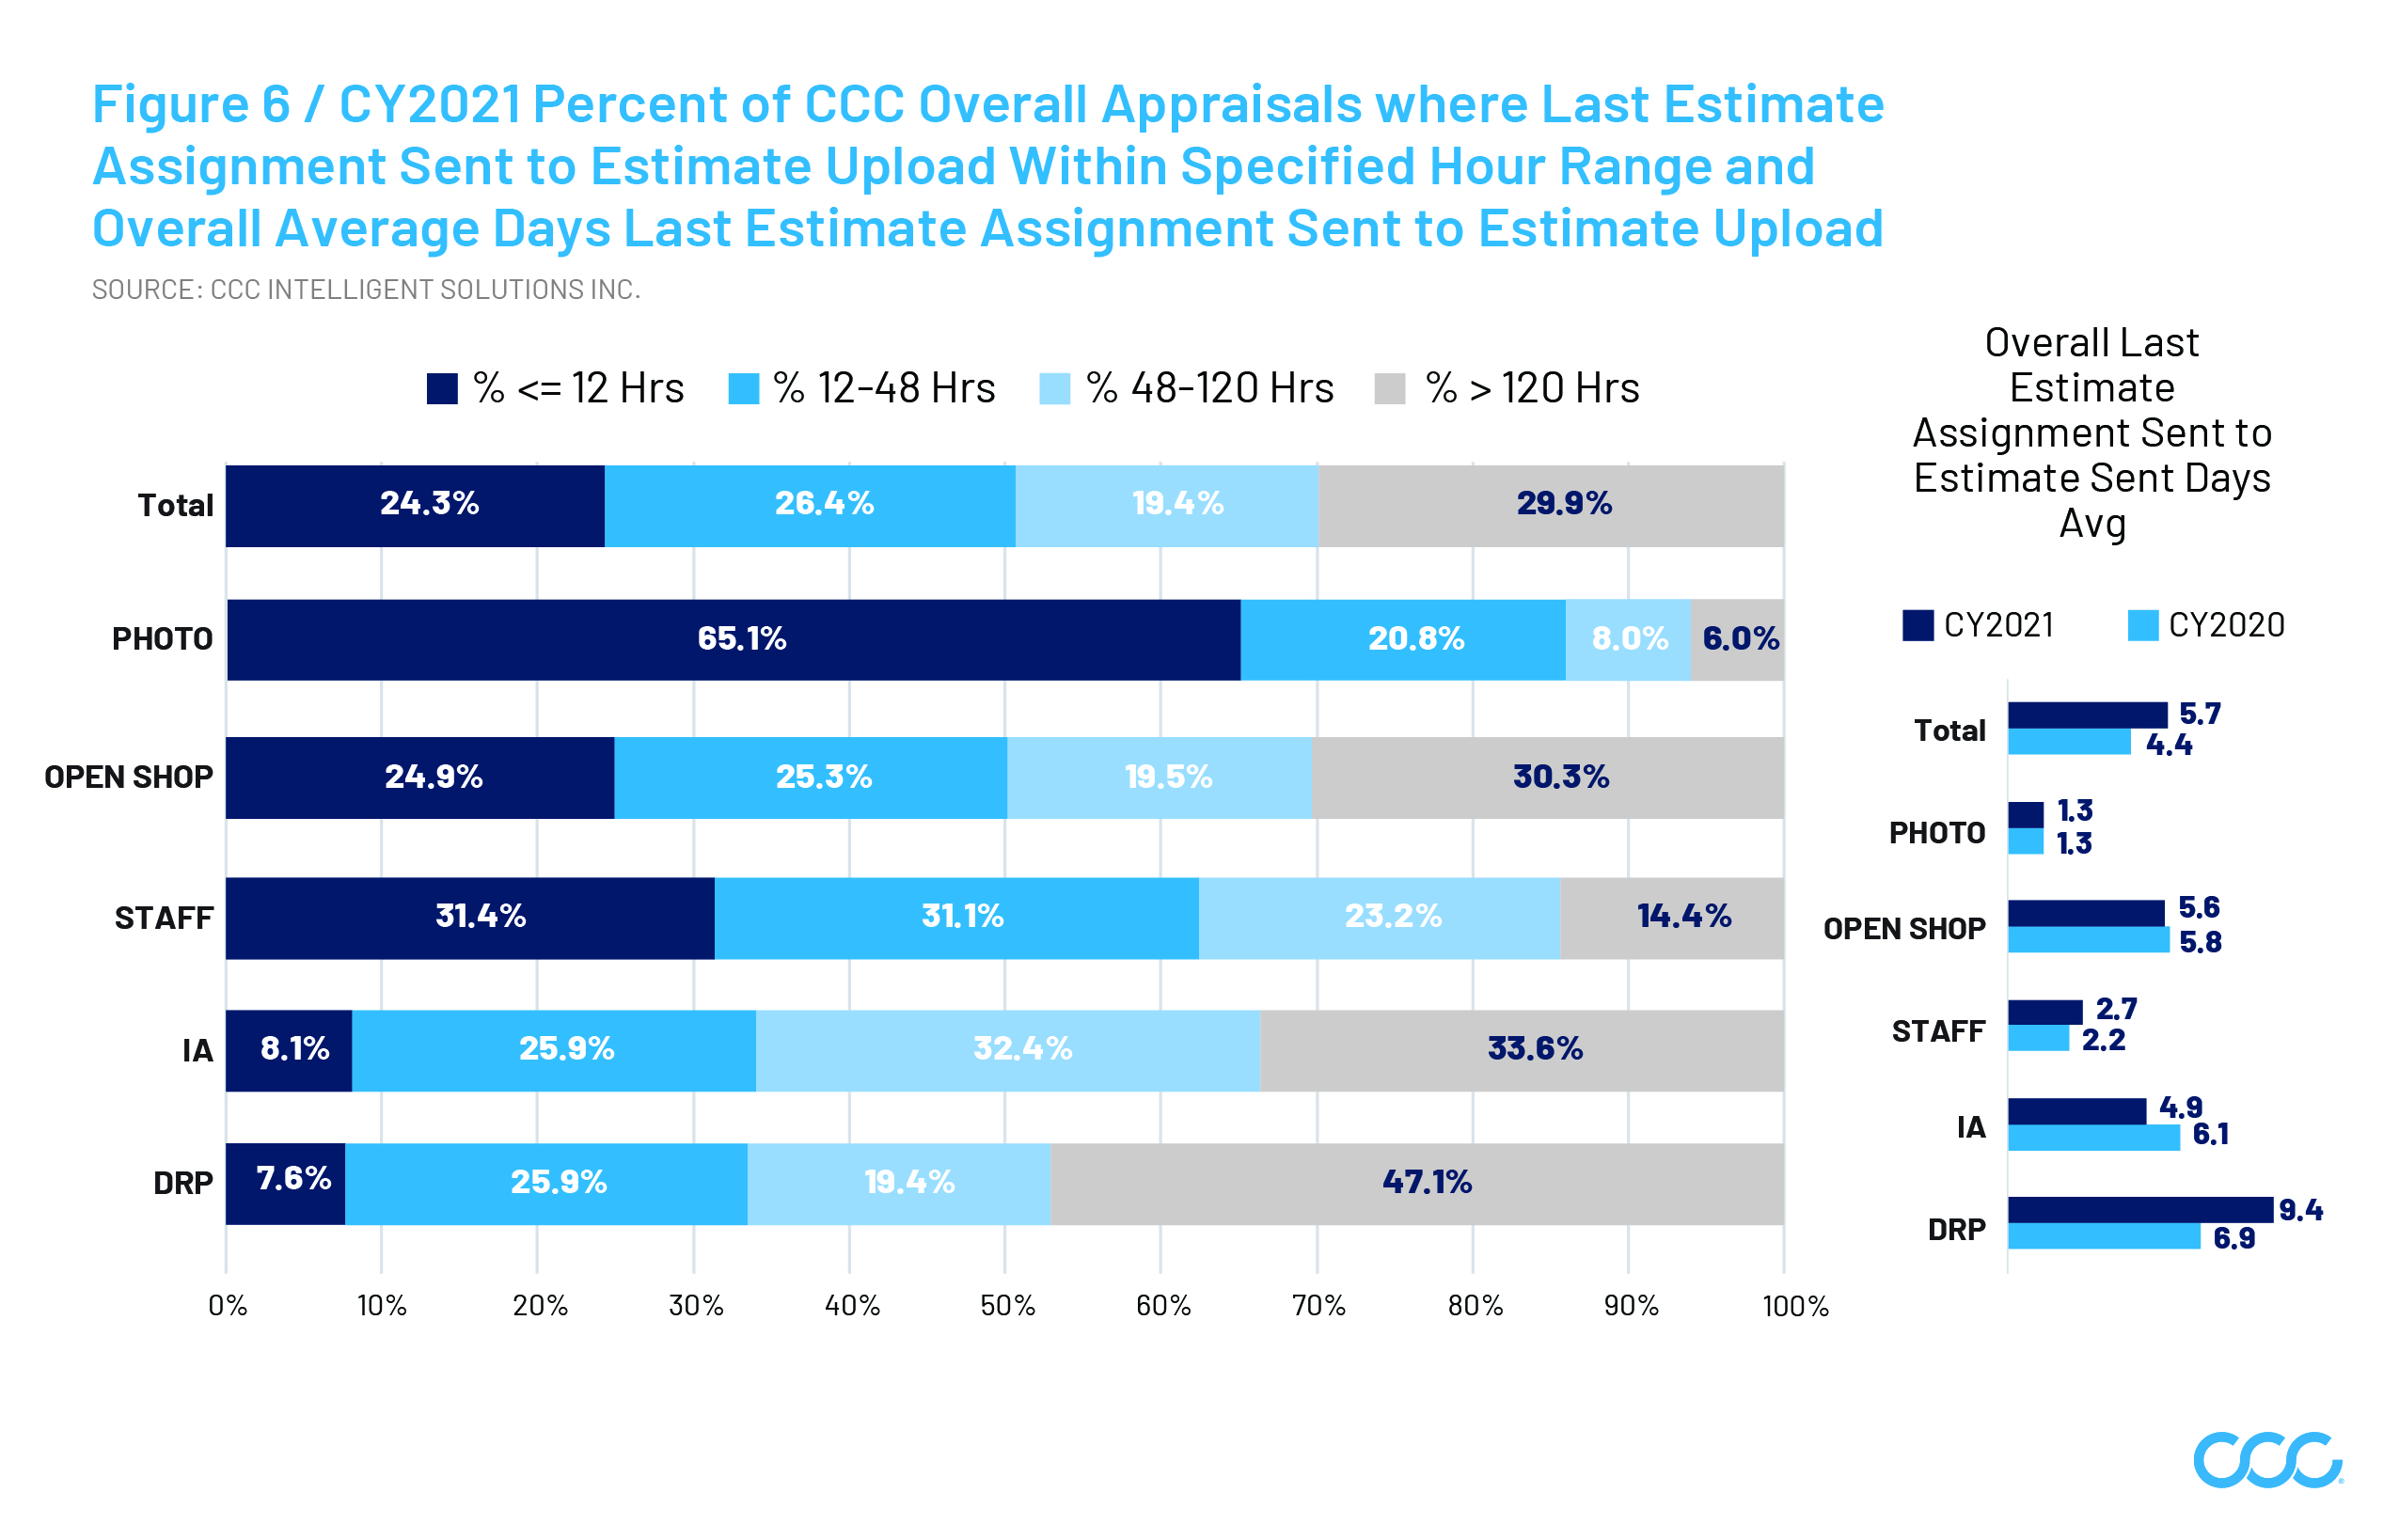 The report found that one technology, photo estimating, shortens the time from first notice of loss to estimate completion from an average of 5.7 days to just 1.3 days.
“The time to get an appraisal has increased for traditional channels where the customer either is visited by an insurance staff appraiser or brings their vehicle in for a DRP appraisal. The exception? Appraisals that utilize photo estimating technology, which continues to provide customers with their initial appraisal and the information they need to make decisions much faster, such as whether they want to have their car repaired and/or make an insurance claim,” the report states.
Gotsch said CCC’s data shows that the increasing use of photo estimating is not driving the documented rise in supplement frequency.
“When you compare the different methods of inspection, the percent of claims that have a supplement and the average settlement amount are really no different between staff-written appraisals and photos,” she said. The increase in supplement frequency “largely has to do with the fact that many more parts are identified in supplements now, once tear down is completed.”
“When you break down overall claim cycle time, especially for driveable vehicles, which is still us roughly 75% of the claims volume, the duration of days where you’re waiting for the customer to make up their mind … are some of the longest days duration out of the whole cycle time,” Gotsch said.
Gotsch also said CCC’s data shows that customers are more likely to file a claim if they can do so digitally, at any hour of the day. That means more work for auto body shops, she said.
Repair cycle times
CCC found that both driveable and non-driveable DRP repairs are taking longer, while repairer productivity has fallen. “Unfortunately, as repair costs climb, repairer productivity can sometimes suffer, customer satisfaction can fall, and the likelihood that the customer needs to bring their vehicle back for additional work after repairs completed also increases,” the report states.
In 2021, the time from a vehicle arriving to the start of repairs was an average of 0.6 days, an increase of 0.2 days from 2020. Repairs took an average of 8.9 days to complete, versus 7.3 days in 2020, while the time from repair completion to the customer picking up their vehicle remained at 0.8 days.
As vehicle complexity increases, so does supplement frequency. A growing share of non-comprehensive claims require more than one supplement, while the share of the overall cost added during supplements has grown.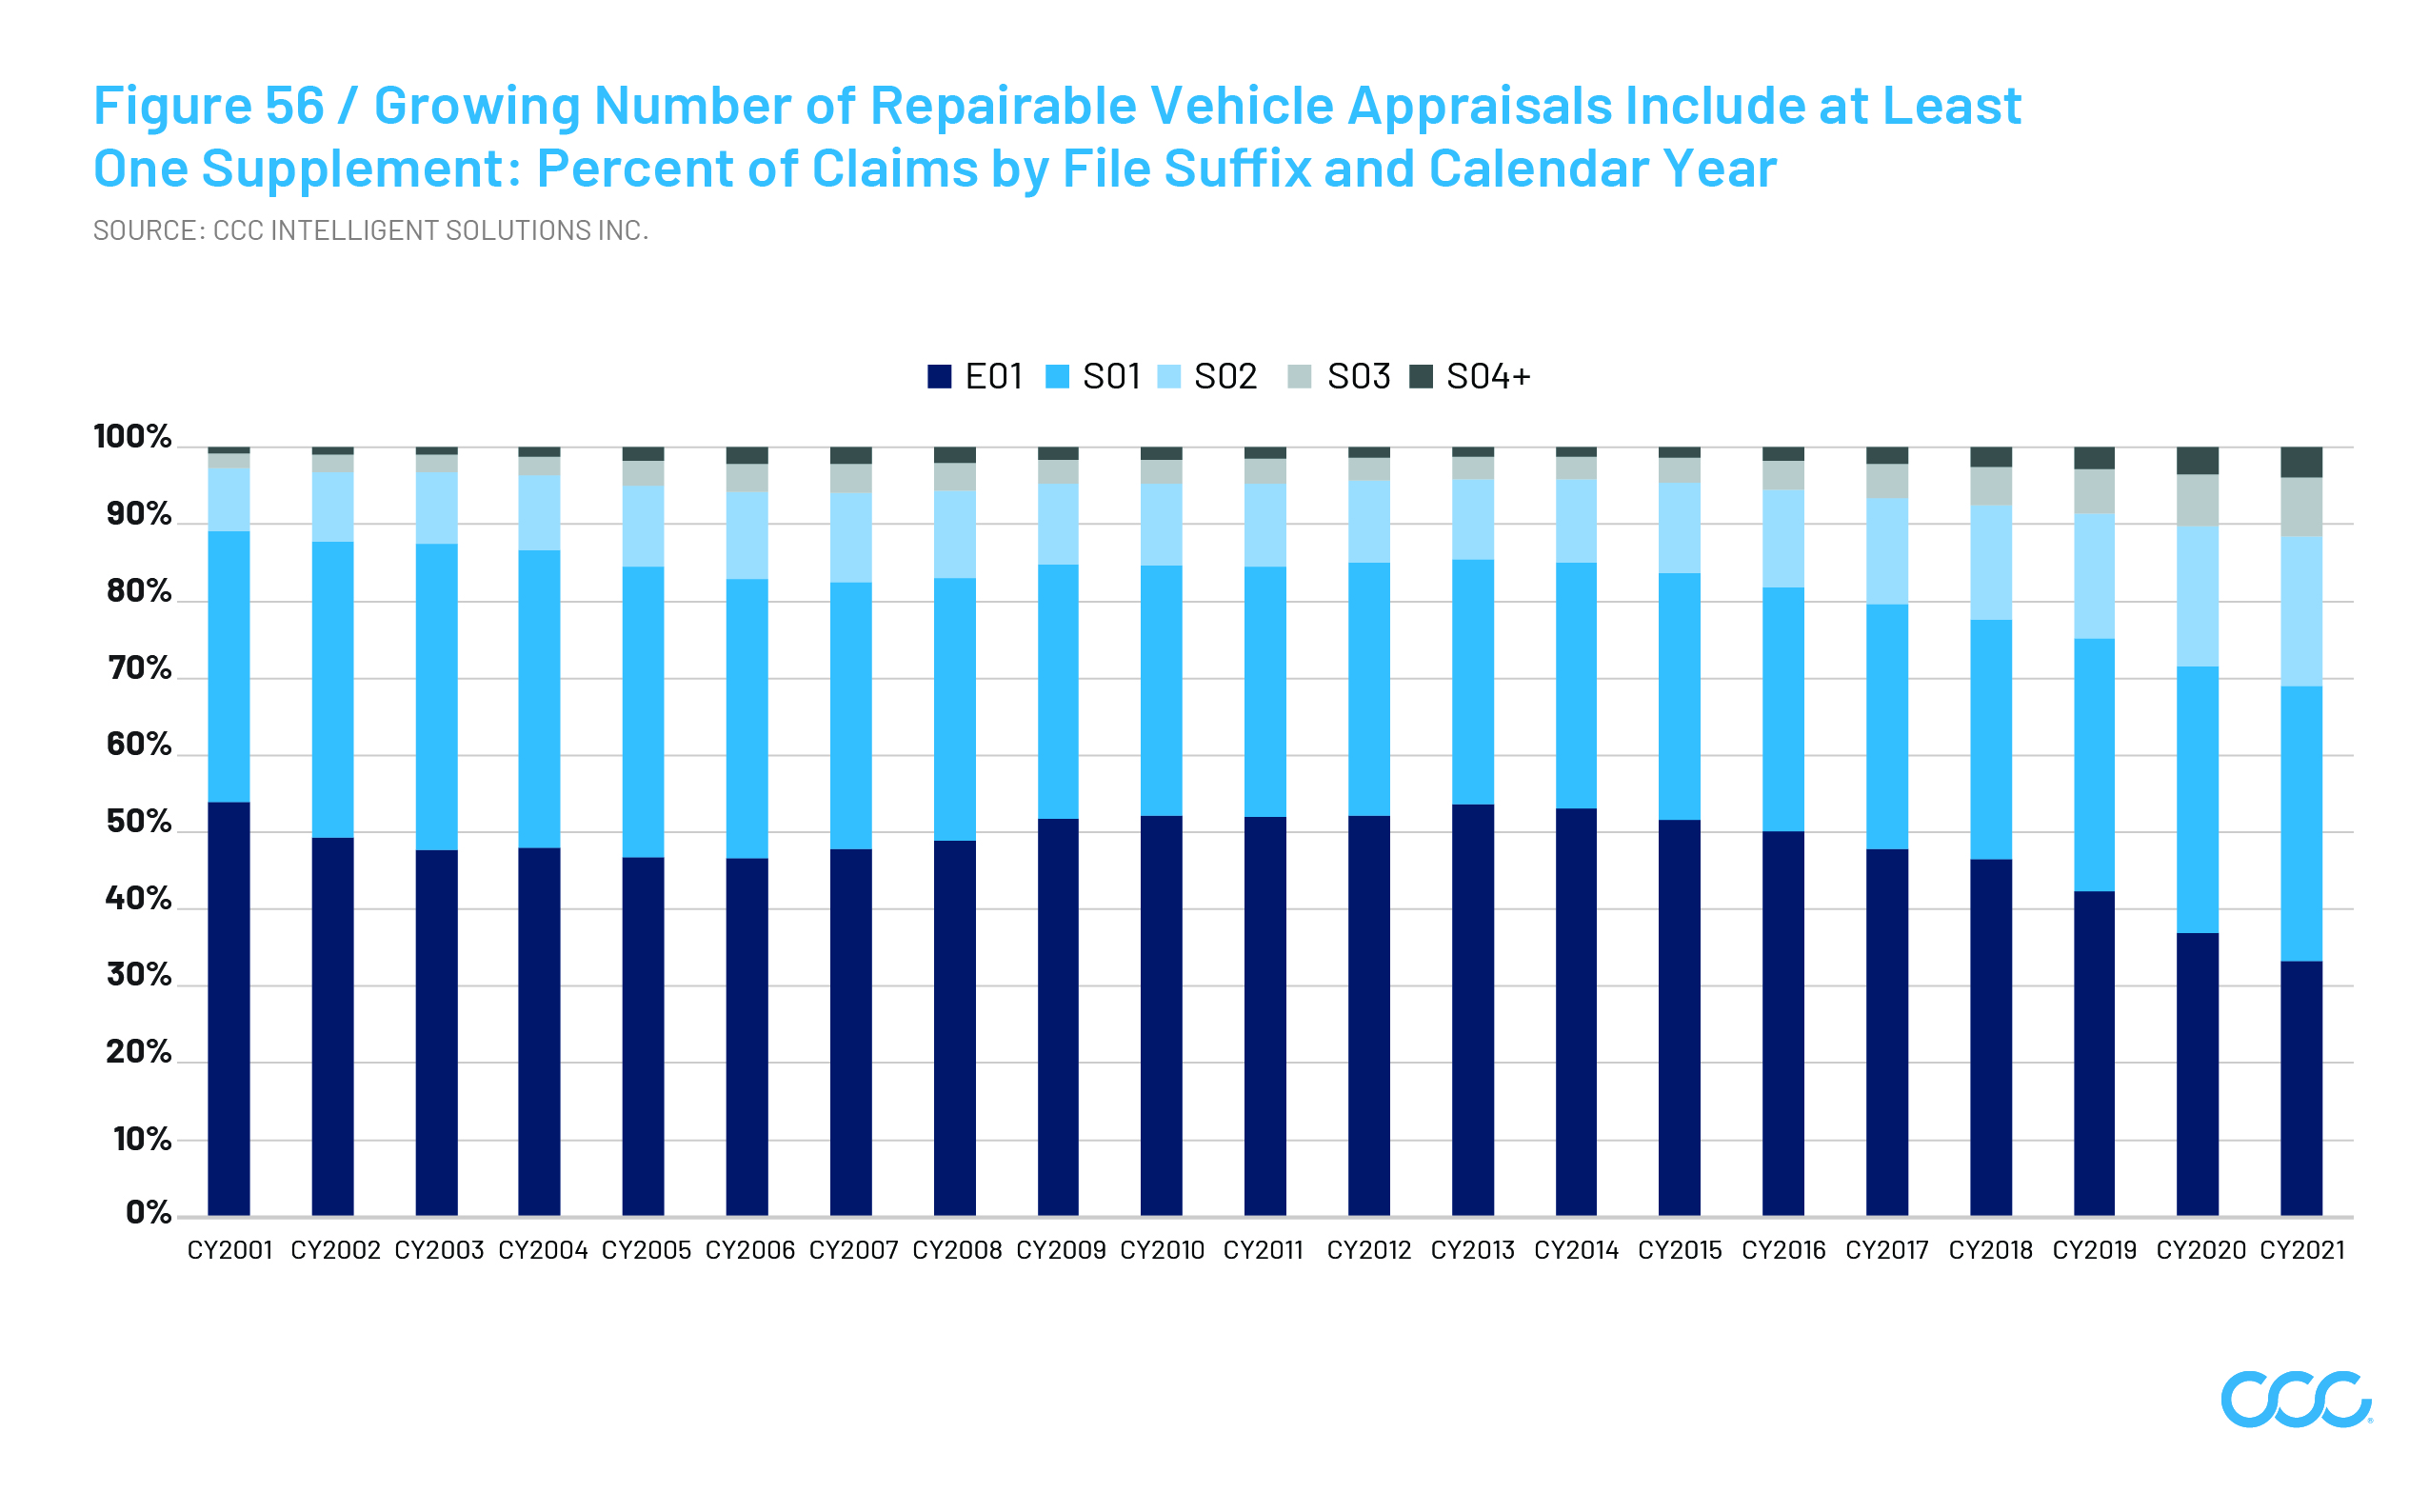 “Analysis of scan and calibration vehicle appraisal line entries, as well as those with parts or operations related to ADAS reveals a large share are added on supplements, underscoring the challenge identifying all of the needed repairs at the time the estimate is generated, especially if no tear down is performed,” the report states. “Combined, these factors help explain the increase in average repair costs overall.”
Gotsch said CCC has not done a direct analysis of the correlation between supplement frequency and repair cycle times, “but what we do know is that as the supplement frequency rises as repair cost rises, both in terms of the number of supplements and the dollars and as the repair cost rises, cycle times rise. And so that would essentially then tell us that, yes, you’re going to have longer cycle times in those instances where you typically have more supplements, but it’s not necessarily because of the supplements per se. It’s more just the nature of the repair.”
She said CCC is hearing “that repairs are feeling that they’re getting slower response times” from insurers, and suggested that may be an effect of workers opting to retire. “They’re not able to replace those people as easily,” she said. “And it’s a job that requires training and experience.”
There is much, much more to be gleaned from the 2022 Crash Course, including the operational future of automakers, insurers, repairers, and other providers, changes in driving behaviors, and the impact to frequency and severity of auto accidents and auto casualty claims.
More information
See how auto body industry worked, earned during pandemic with CCC’s 2021 ‘Crash Course”
Images
Featured image: The cover of Crash Course 2022. (Provided by CCC)
CCC director and lead analyst Susanna Gotsch was the author of CCC’s 2022 “Crash Course.” (Provided by CCC/Heather Eidson)
Graphs and charts provided by CCC